View methods side by side.
Choose up to four methods. Add them using the search and share the comparison by copying its link.
| Criterion | 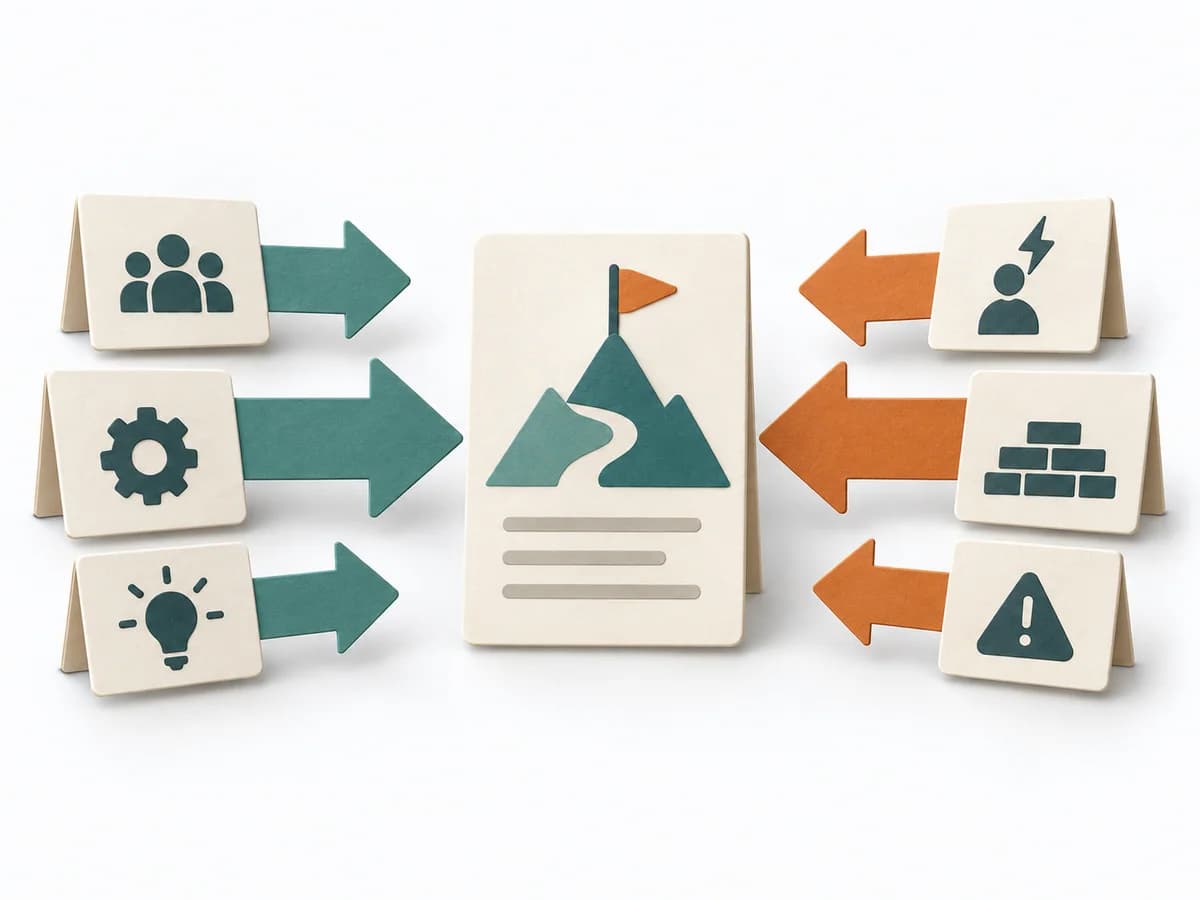 Decision Making Force Field Analysis |  Growth Pirate Metrics AARRR |  Decision Making OODA Loop |  Growth A/B Testing |
|---|---|---|---|---|
Purposedifferent | In change initiatives, supporting and restraining forces sit at the table at the same time. Force Field Analysis makes these tensions explicit and shows where change can be pushed forward by strengthening or relieving. | For products with complex usage paths, overall growth alone is too coarse to reveal bottlenecks. Pirate Metrics breaks the relationship with the product into consecutive stages and shows where the funnel actually leaks. | In dynamic situations, decisions become outdated faster than they can be prepared. The OODA Loop holds observing, orienting, deciding, and acting together as a recurring rhythm so reaction does not slide into inertia. | When two variants compete, discussions quickly decide by taste rather than effect. A/B Testing checks behavior under controlled conditions and separates real improvement from chance or expectation effects. |
Complexitydifferent | Low | Medium | Medium | High |
Timedifferent | 45-90 min | 1-2 h Setup, laufend | 15-60 min je Zyklus | 1-4 Wochen |
Participantsdifferent | 3-12 | 2-8 | 1-8 | 1-6 |
Formatdifferent | Workshop | Workshop + async | Workshop + async | Async |
Outputdifferent | Force Field Map, Change Levers, Risk Notes | AARRR funnel, Metric baseline, Experiment backlog | Situation Assessment, Decision Loop, Action Updates | Experiment results, Decision log, Learning summary |
Tagsno overlap | ChangeDecisionStrategy | GrowthMetricsExperiments | DecisionChangeLearningStrategy | ExperimentsGrowthAnalyticsValidation |