View methods side by side.
Choose up to four methods. Add them using the search and share the comparison by copying its link.
Selected:Failure Mode and Effects AnalysisStrategic, Tactical and Operational PlanningATAM (Architecture Tradeoff Analysis Method)Fishbone Diagram
| Criterion |  Operations Failure Mode and Effects Analysis | 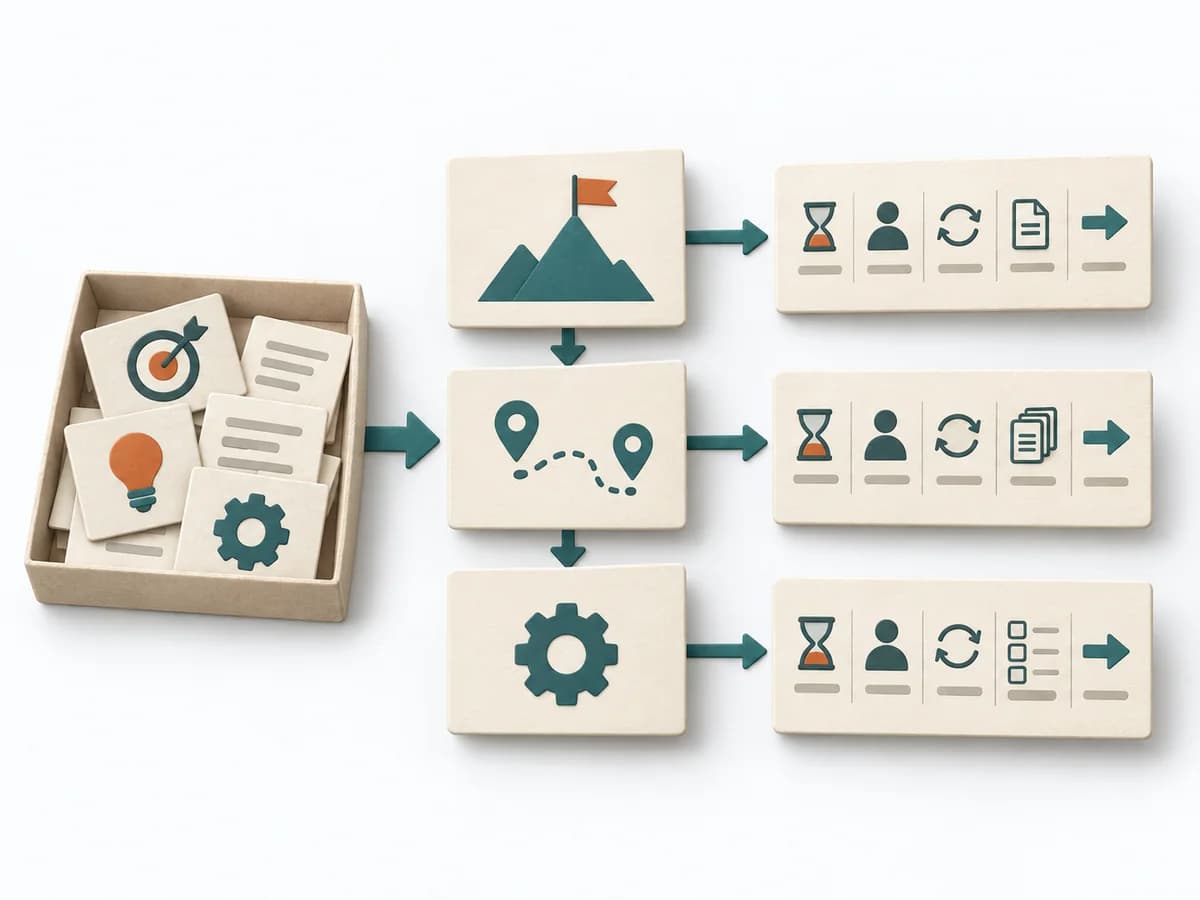 Business Strategy Strategic, Tactical and Operational Planning |  Architecture ATAM (Architecture Tradeoff Analysis Method) |  Operations Fishbone Diagram |
|---|---|---|---|---|
Purposedifferent | For a process, product, or service with noticeable failure risks, the method assesses possible failure modes in advance. It directs attention to combinations of occurrence, effect, and detectability. | It places decisions and artifacts at the right level. Strategic planning clarifies direction, tactical planning translates it into programs, and operational planning steers concrete processes. | ATAM helps teams weigh architecture decisions when quality goals compete. The team considers business goals, stakeholder expectations, and technical decisions together. The evaluation shows which risks need further investigation. | When a problem has several possible contributing factors, the method sorts causes by cause areas. It prevents an initial hunch from blocking the view of other plausible drivers. |
Complexitydifferent | High | Medium | High | Low |
Timedifferent | 2-6 h | 90-180 min | Several meetings plus preparation and analysis; total effort depends on scope | 30-60 min |
Participantsdifferent | 3-10 | 4-12 | Evaluation team, architects, and relevant stakeholders | 2-8 |
Formatdifferent | Workshop | Workshop | Workshop + async | Workshop |
Outputdifferent | FMEA Table, Risk Priority, Mitigation Actions | Planning Levels Map, Cadence Model, Planning Artifact Inventory | Prioritized quality scenarios in a utility tree, Architecture risks with reasoning and assumptions, Sensitivity and trade-off points, Findings report with open investigations | Fishbone Diagram, Cause Categories, Investigation Backlog |
Tagsno overlap | RiskQualityOperationsRoot cause | CadenceGovernanceExecution | ArchitectureQualityRiskTradeoffsStakeholders | Root causeQualityOperations |