View methods side by side.
Choose up to four methods. Add them using the search and share the comparison by copying its link.
| Criterion |  Operations Failure Mode and Effects Analysis | 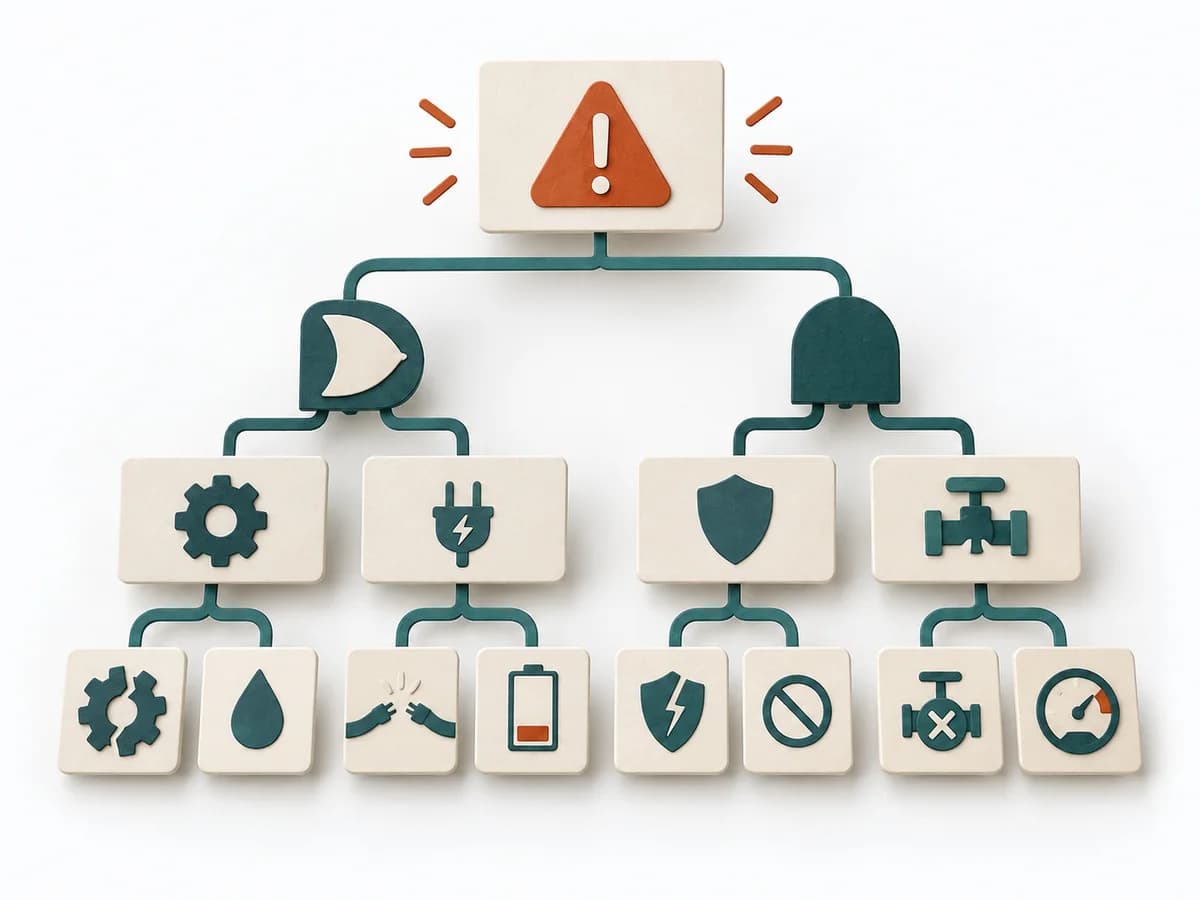 Operations Fault Tree Analysis |  Operations Fishbone Diagram | 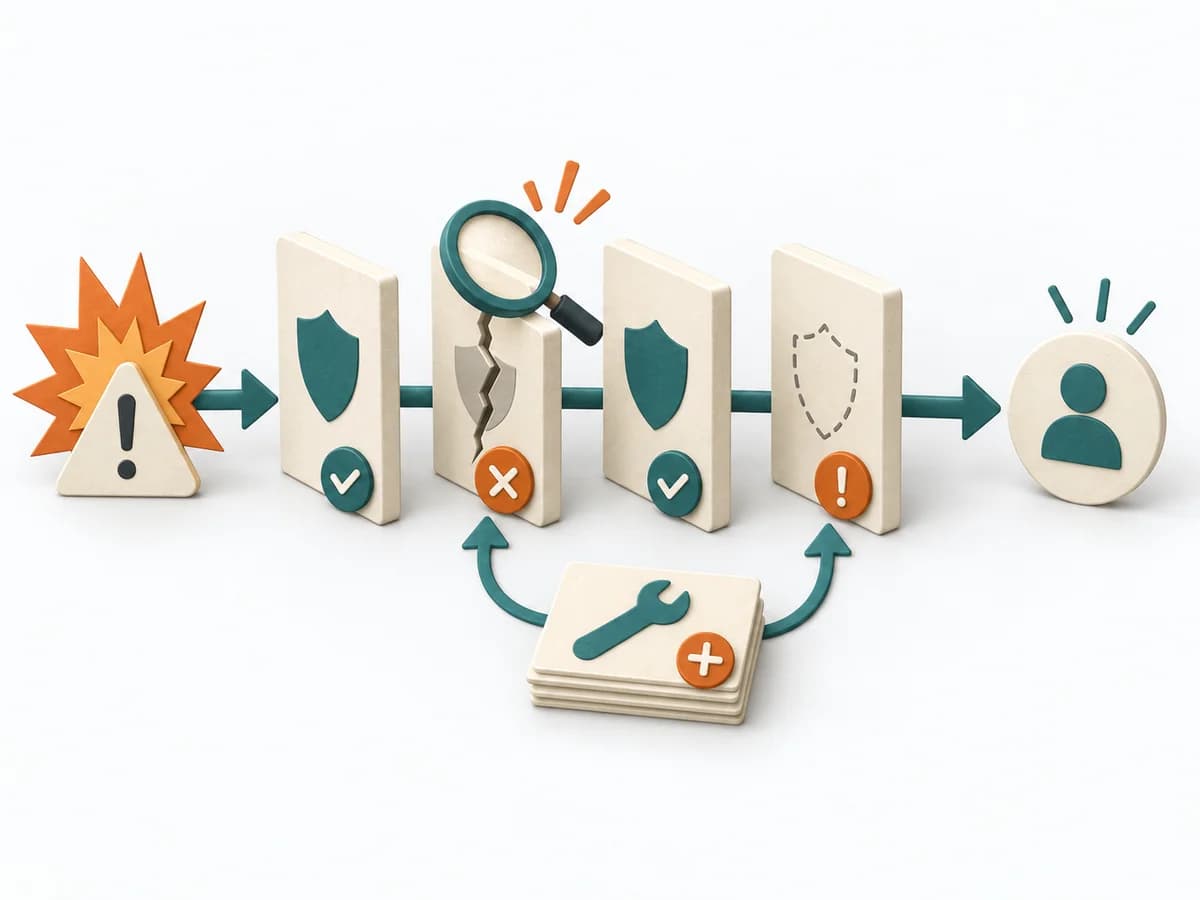 Operations Barrier Analysis |
|---|---|---|---|---|
Purposedifferent | For a process, product, or service with noticeable failure risks, the method assesses possible failure modes in advance. It directs attention to combinations of occurrence, effect, and detectability. | For a critical top event with several possible triggers, the method logically models failure paths. It makes visible which combinations of conditions can lead to damage. | When a problem has several possible contributing factors, the method sorts causes by cause areas. It prevents an initial hunch from blocking the view of other plausible drivers. | For a risk that can only be managed through multiple layers of protection, the method examines the effectiveness of each barrier. It shows where safeguards are missing, too weak, or fail under real conditions. |
Complexitydifferent | High | High | Low | Medium |
Timedifferent | 2-6 h | 2-6 h | 30-60 min | 2-4 h |
Participantsdifferent | 3-10 | 3-8 | 2-8 | 2-6 |
Formatdifferent | Workshop | Workshop + async | Workshop | Workshop + async |
Outputdifferent | FMEA Table, Risk Priority, Mitigation Actions | Fault Tree, Critical Paths, Cause Hypotheses, Control Actions | Fishbone Diagram, Cause Categories, Investigation Backlog | Barrier Inventory, Failure Analysis per Barrier, Action Backlog |
Tags1 shared | RiskQualityOperationsRoot cause | RiskRoot causeSafety | Root causeQualityOperations | Root causeSafetyIncident |