View methods side by side.
Choose up to four methods. Add them using the search and share the comparison by copying its link.
| Criterion |  Operations Fishbone Diagram | 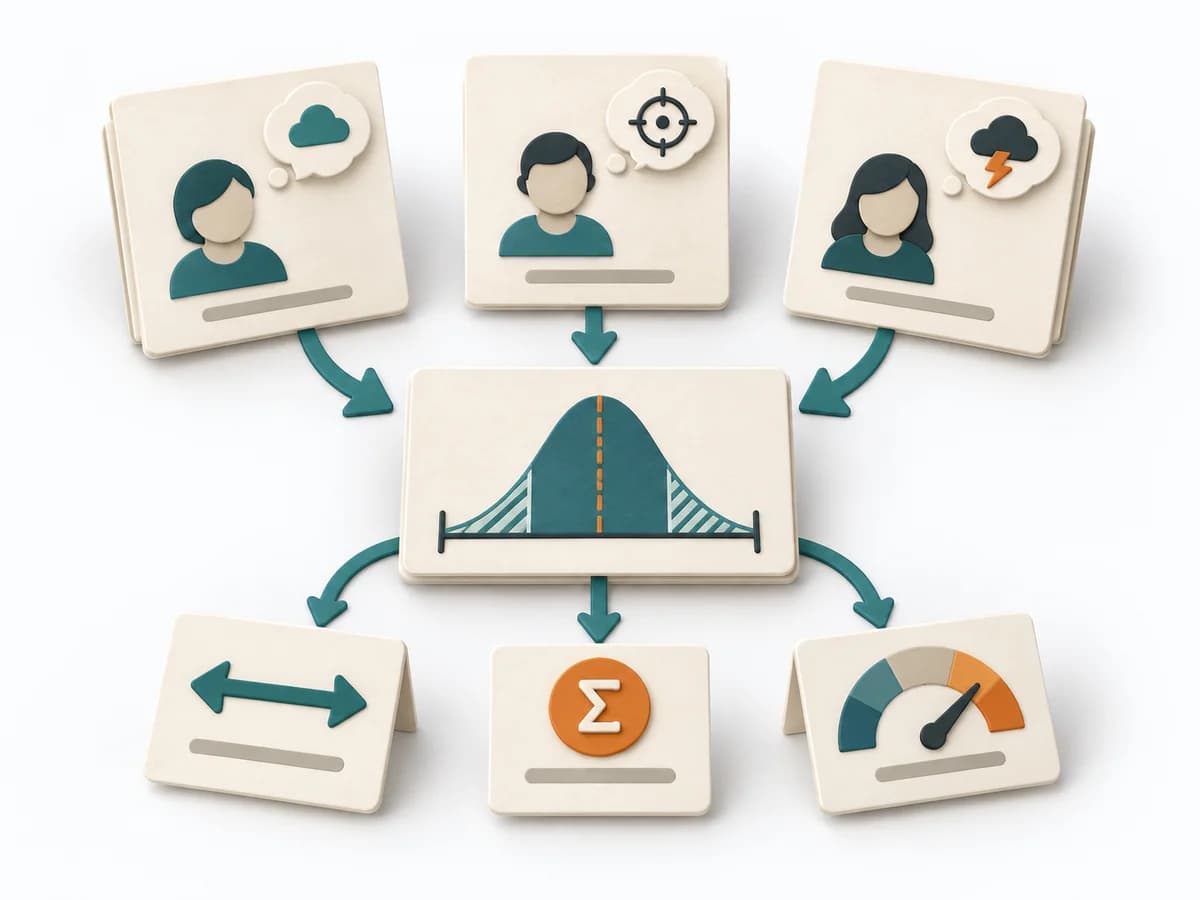 Decision Making Three-Point Estimation | 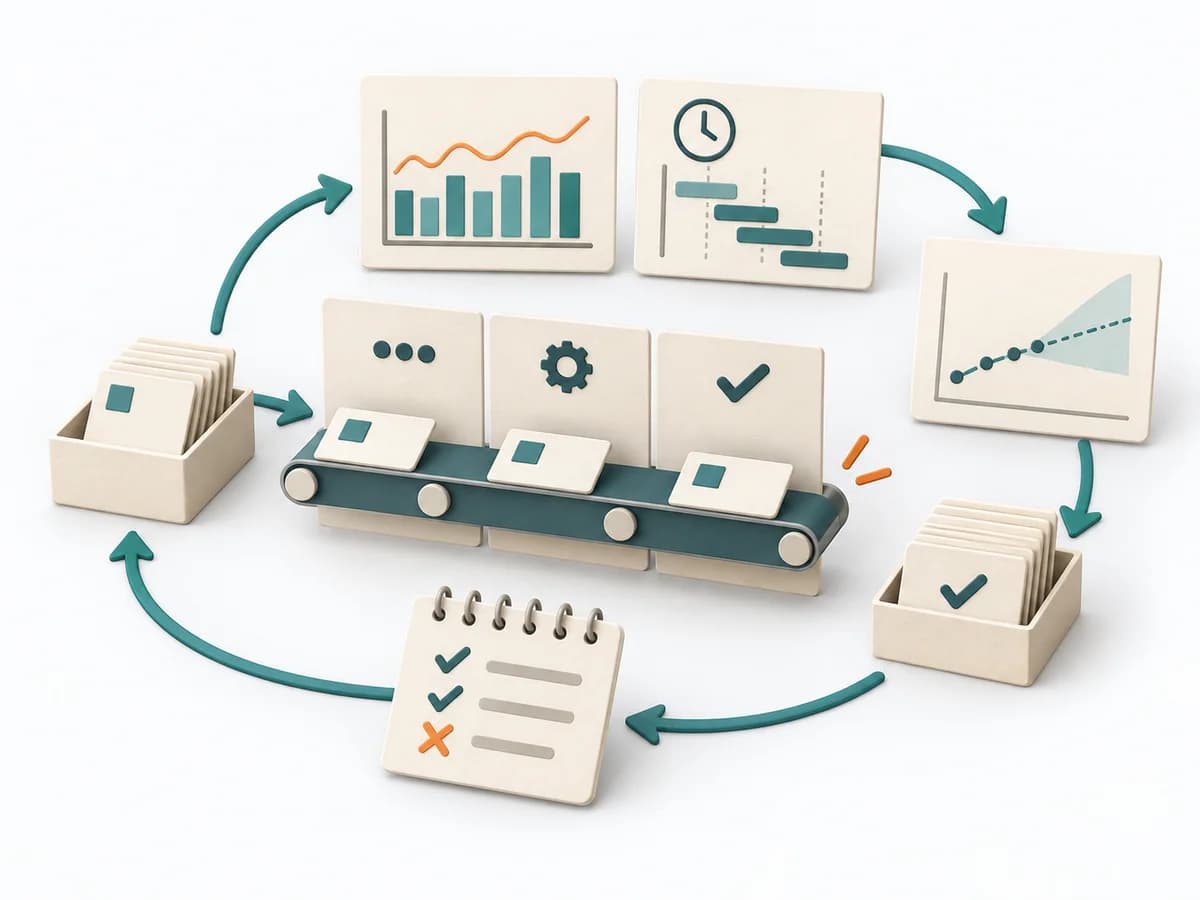 Agile NoEstimates |  Operations Failure Mode and Effects Analysis |
|---|---|---|---|---|
Purposedifferent | When a problem has several possible contributing factors, the method sorts causes by cause areas. It prevents an initial hunch from blocking the view of other plausible drivers. | A single estimate for effort, time, or risk often looks too smooth for the real uncertainty behind it. It separates options, evaluation criteria, and open risks. The result is captured as a Three-Point Estimate, Risk Range, and Assumption Notes. | When estimating slows a team down more than it helps, it shifts the focus to flow, small slices, and real lead time. It sorts work by value, risk, and delivery ability. The result is captured as Throughput Data, Flow Forecast, and Slicing Rules. | For a process, product, or service with noticeable failure risks, the method assesses possible failure modes in advance. It directs attention to combinations of occurrence, effect, and detectability. |
Complexitydifferent | Low | Medium | Medium | High |
Timedifferent | 30-60 min | 10-30 min je Item | laufend | 2-6 h |
Participantsdifferent | 2-8 | 1-8 | 2-12 | 3-10 |
Formatdifferent | Workshop | Workshop + async | Workshop + async | Workshop |
Outputdifferent | Fishbone Diagram, Cause Categories, Investigation Backlog | Three-Point Estimate, Risk Range, Assumption Notes | Throughput Data, Flow Forecast, Slicing Rules | FMEA Table, Risk Priority, Mitigation Actions |
Tagsno overlap | Root causeQualityOperations | EstimationUncertaintyForecasting | EstimationForecastingFlow | RiskQualityOperationsRoot cause |