View methods side by side.
Choose up to four methods. Add them using the search and share the comparison by copying its link.
| Criterion |  Operations Fishbone Diagram |  Operations Failure Mode and Effects Analysis | 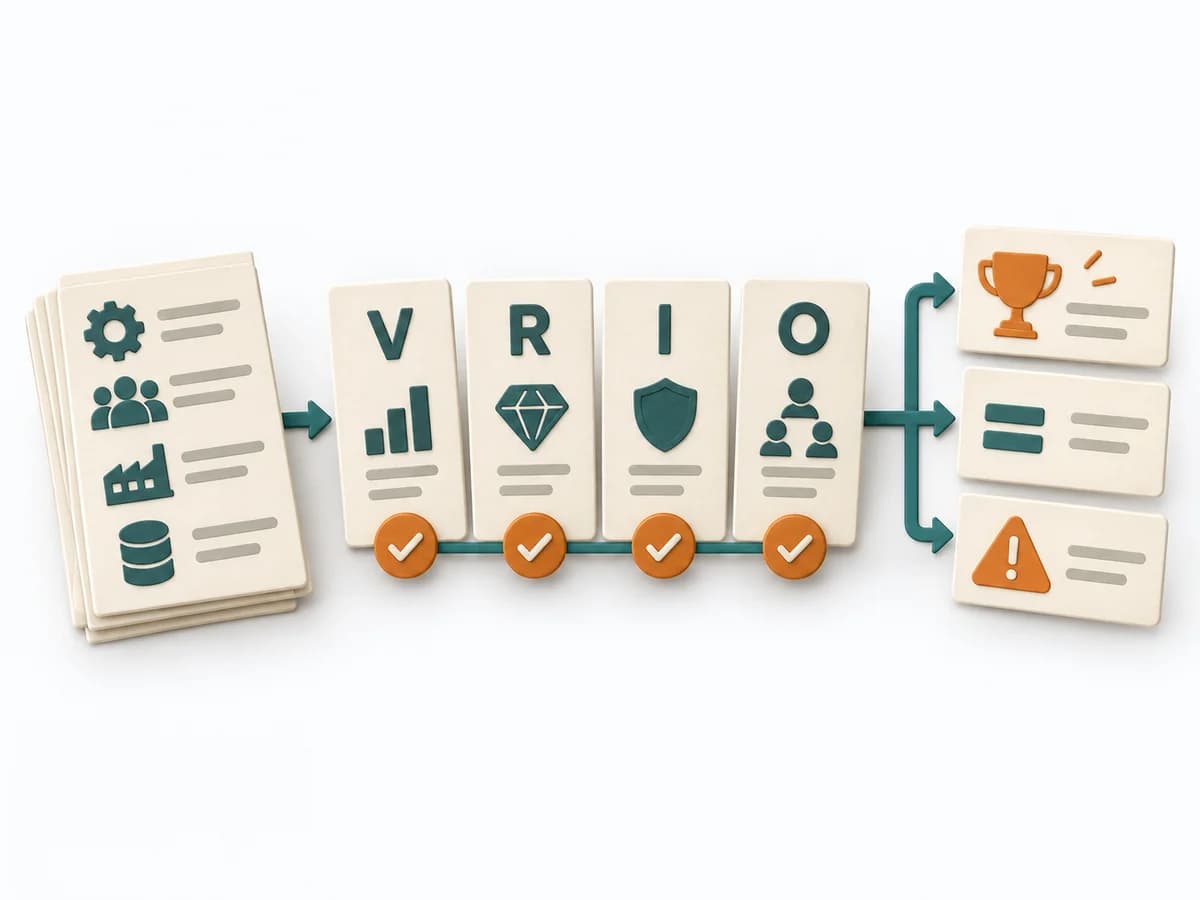 Business Strategy VRIO Framework | 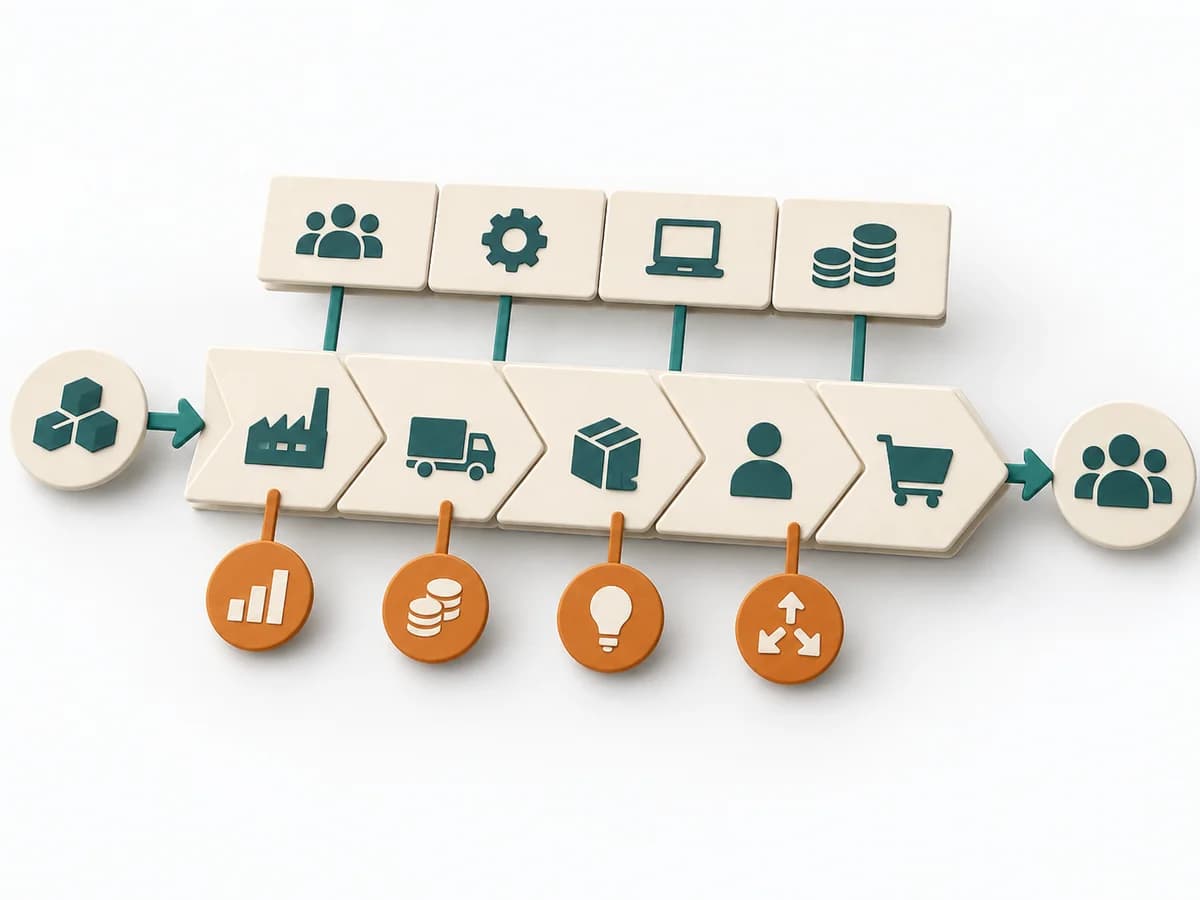 Business Strategy Value Chain Analysis |
|---|---|---|---|---|
Purposedifferent | When a problem has several possible contributing factors, the method sorts causes by cause areas. It prevents an initial hunch from blocking the view of other plausible drivers. | For a process, product, or service with noticeable failure risks, the method assesses possible failure modes in advance. It directs attention to combinations of occurrence, effect, and detectability. | The VRIO Framework rates resources and capabilities on whether they are Valuable, Rare, Inimitable, and Organized. It compares strengths, risks, market logic, and courses of action. The result is captured as a VRIO table and strategic actions. | Value Chain Analysis shows where value is created, costs accrue, and differentiation becomes possible along the process. It compares strengths, risks, market logic, and courses of action. The result is captured as a value-chain map and lever list. |
Complexitydifferent | Low | High | Medium | High |
Timedifferent | 30-60 min | 2-6 h | 90-180 min | Half day |
Participantsdifferent | 2-8 | 3-10 | 3-6 | 3-8 |
Formatsame | Workshop | Workshop | Workshop | Workshop |
Outputdifferent | Fishbone Diagram, Cause Categories, Investigation Backlog | FMEA Table, Risk Priority, Mitigation Actions | VRIO Table, Strategic Actions | Value Chain Map, Lever List |
Tagsno overlap | Root causeQualityOperations | RiskQualityOperationsRoot cause | StrategyDiagnosisBusiness modelCapability | StrategyBusiness modelDiagnosisAnalysis |