View methods side by side.
Choose up to four methods. Add them using the search and share the comparison by copying its link.
| Criterion |  Operations Fishbone Diagram | 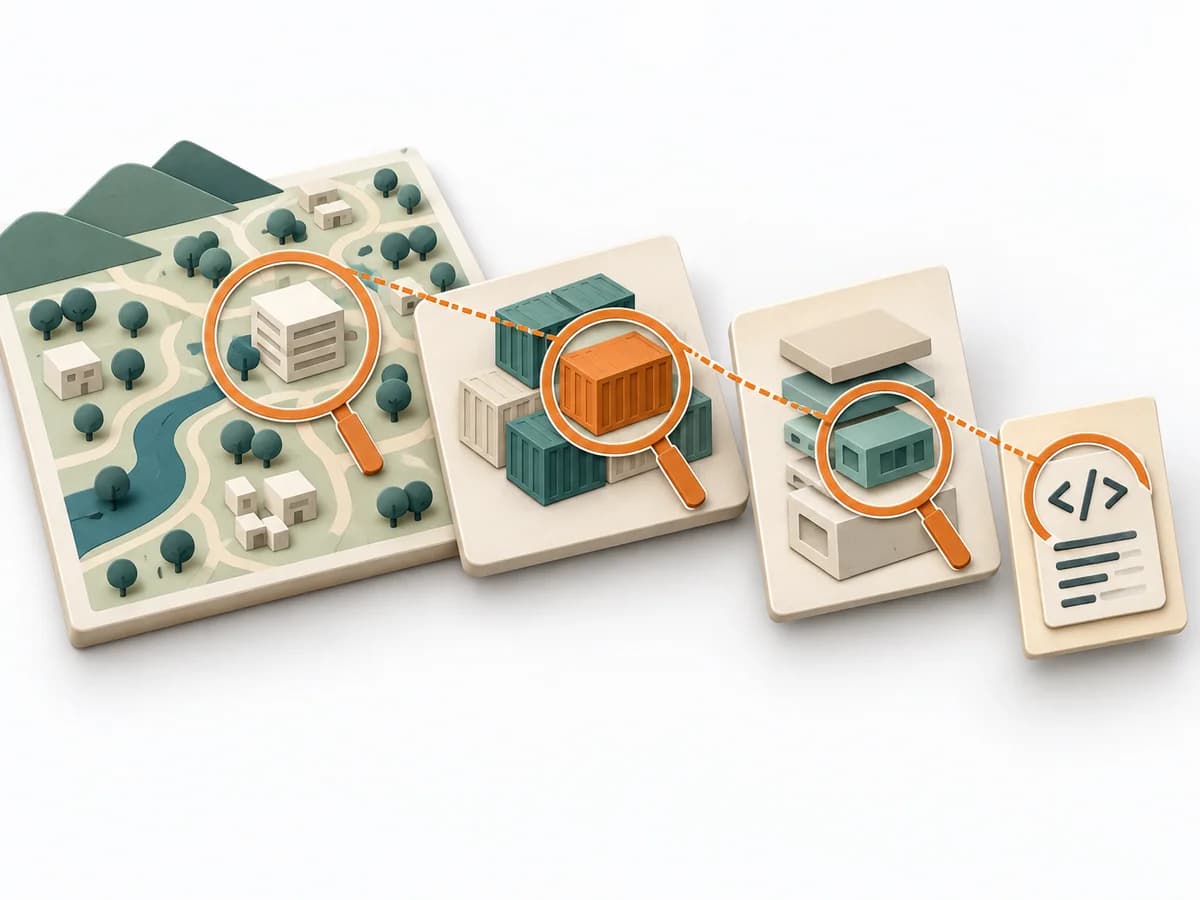 Architecture C4 Model |  Architecture ATAM (Architecture Tradeoff Analysis Method) |  Operations Scatter Diagram |
|---|---|---|---|---|
Purposedifferent | When a problem has several possible contributing factors, the method sorts causes by cause areas. It prevents an initial hunch from blocking the view of other plausible drivers. | The C4 Model makes a system legible across several resolution levels, from context down to code. It suits situations where different audiences need to understand the same architecture from different altitudes. | ATAM helps teams weigh architecture decisions when quality goals compete. The team considers business goals, stakeholder expectations, and technical decisions together. The evaluation shows which risks need further investigation. | When the question is whether two measures are related, the method makes patterns in the data picture visible. It separates felt correlations from relationships that actually show up in the data. |
Complexitydifferent | Low | Low | High | Low |
Timedifferent | 30-60 min | 1-4 h | Several meetings plus preparation and analysis; total effort depends on scope | 30-90 min |
Participantsdifferent | 2-8 | 1-5 | Evaluation team, architects, and relevant stakeholders | 1-4 |
Formatdifferent | Workshop | Workshop + async | Workshop + async | Workshop + async |
Outputdifferent | Fishbone Diagram, Cause Categories, Investigation Backlog | Context Diagram, Container Diagram, Component Diagram | Prioritized quality scenarios in a utility tree, Architecture risks with reasoning and assumptions, Sensitivity and trade-off points, Findings report with open investigations | Scatter Plot, Korrelationsnotiz, Hypothesenliste |
Tagsno overlap | Root causeQualityOperations | ArchitectureCommunicationVisualization | ArchitectureQualityRiskTradeoffsStakeholders | Root causeQualityVisualization |