View methods side by side.
Choose up to four methods. Add them using the search and share the comparison by copying its link.
| Criterion |  Operations Fishbone Diagram | 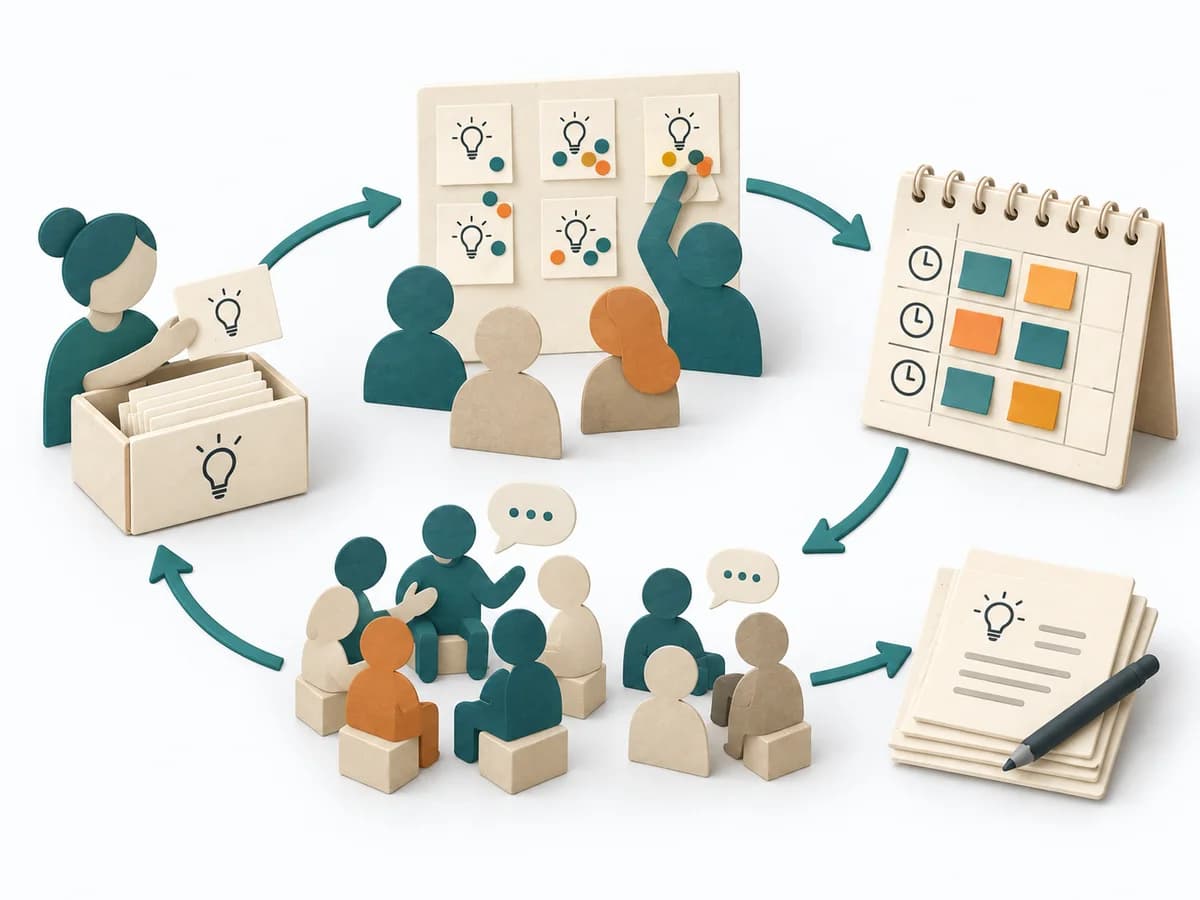 Facilitation Barcamp |  Operations Failure Mode and Effects Analysis | 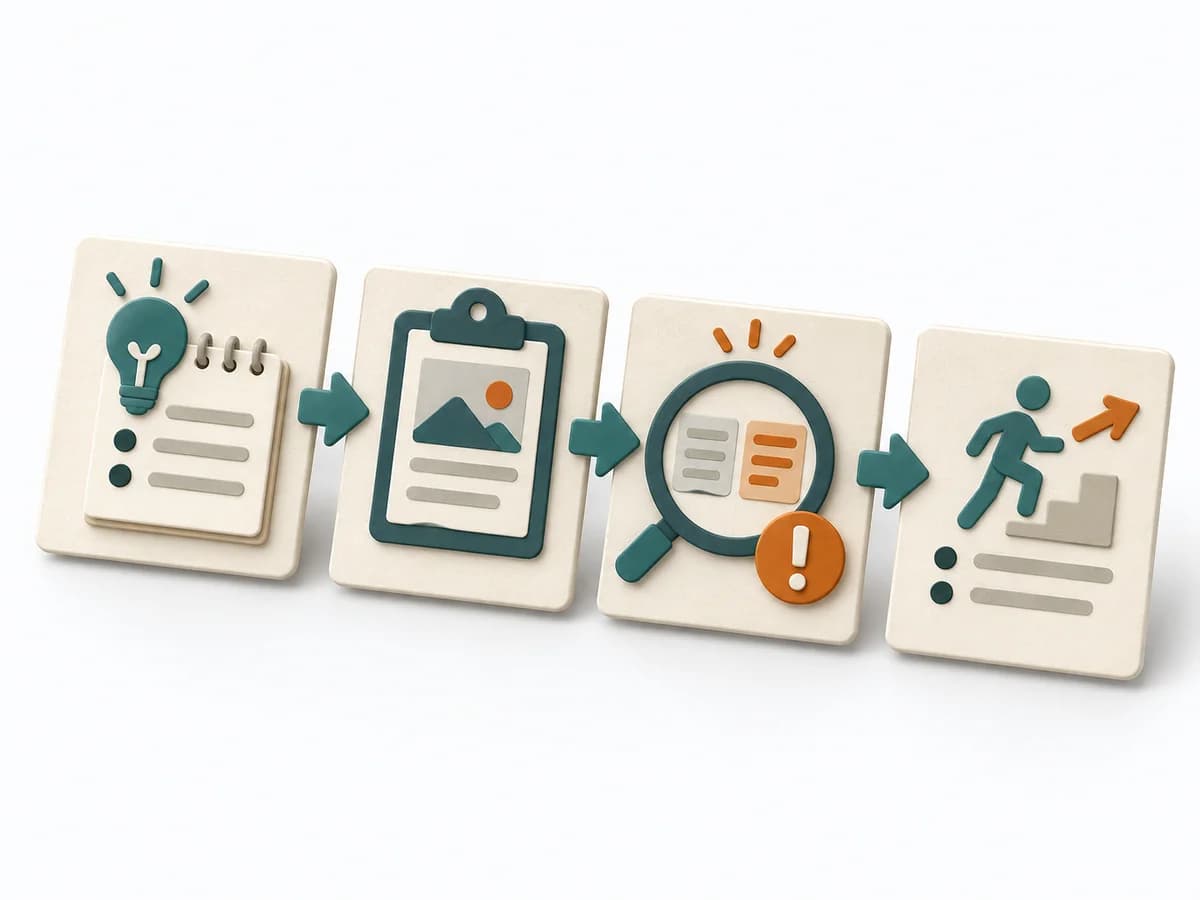 Operations After-Action Review |
|---|---|---|---|---|
Purposedifferent | When a problem has several possible contributing factors, the method sorts causes by cause areas. It prevents an initial hunch from blocking the view of other plausible drivers. | When many people can contribute knowledge and the flow should stay open, Barcamp provides a framework for self-organized sessions. The format channels energy without defining the content too narrowly in advance. | For a process, product, or service with noticeable failure risks, the method assesses possible failure modes in advance. It directs attention to combinations of occurrence, effect, and detectability. | After missions or project phases with unclear outcomes, the method makes visible what actually happened and what can be learned from it. It separates course, effect, and causes so experience turns into solid improvement. |
Complexitydifferent | Low | Medium | High | Low |
Timedifferent | 30-60 min | Halber Tag bis 2 Tage | 2-6 h | 20-45 min |
Participantsdifferent | 2-8 | 15-200 | 3-10 | 3-12 |
Formatdifferent | Workshop | Workshop | Workshop | Workshop + async |
Outputdifferent | Fishbone Diagram, Cause Categories, Investigation Backlog | Session Board, Session Notes, Community Learnings | FMEA Table, Risk Priority, Mitigation Actions | Lessons learned, Action items, Event summary |
Tagsno overlap | Root causeQualityOperations | FacilitationLarge groupLearning | RiskQualityOperationsRoot cause | LearningOperationsImprovement |