View methods side by side.
Choose up to four methods. Add them using the search and share the comparison by copying its link.
Selected:Fishbone DiagramAlignment MappingStakeholder Salience ModelFailure Mode and Effects Analysis
| Criterion |  Operations Fishbone Diagram |  Facilitation Alignment Mapping | 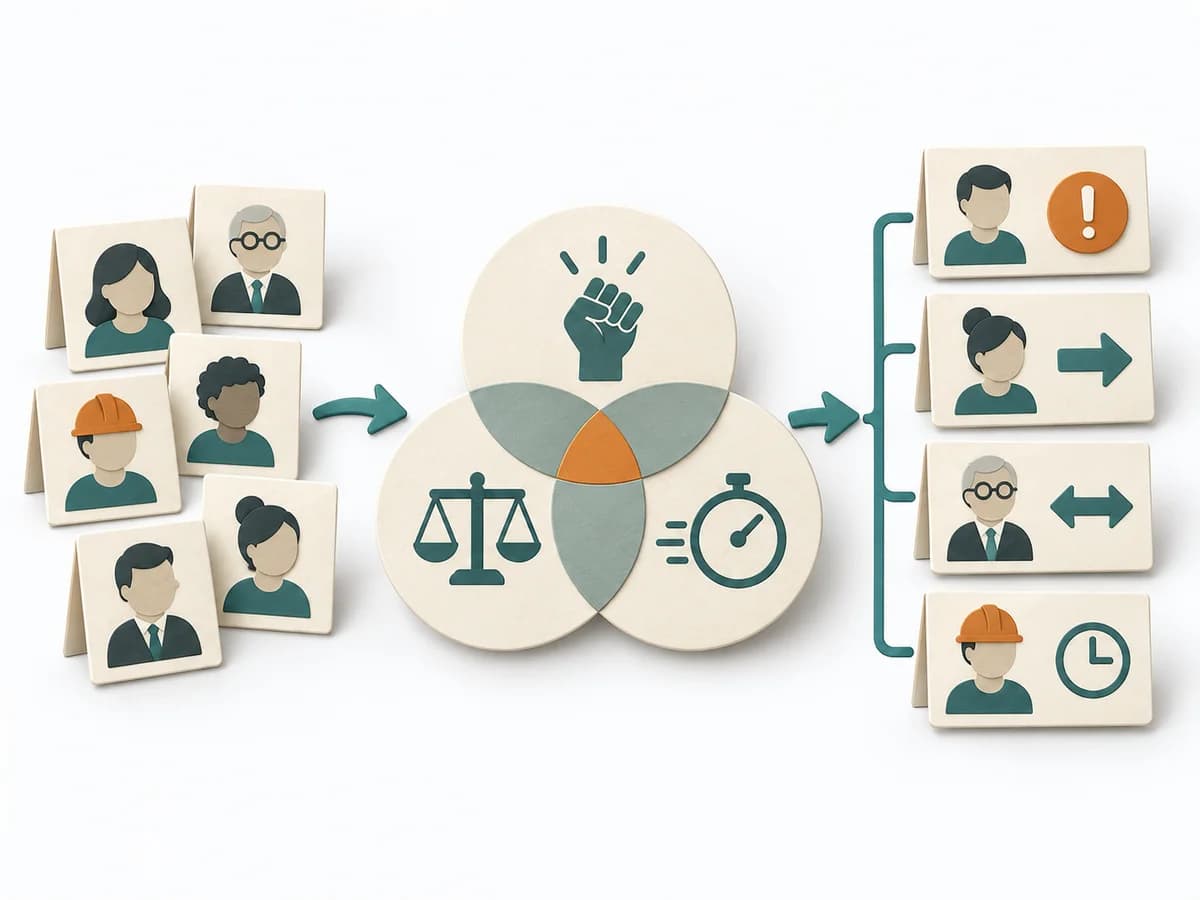 Facilitation Stakeholder Salience Model |  Operations Failure Mode and Effects Analysis |
|---|---|---|---|---|
Purposedifferent | When a problem has several possible contributing factors, the method sorts causes by cause areas. It prevents an initial hunch from blocking the view of other plausible drivers. | When several people work toward one goal but hold different mental maps, Alignment Mapping makes the discrepancies visible. It arranges goals, assumptions, and priorities so shared direction becomes verifiable. | When stakeholders appear to matter very differently, the Stakeholder Salience Model rates their actual priority through power, legitimacy, and urgency. It turns individual contributions into a visible selection. The result is captured as a Salience diagram and a class-based strategy. | For a process, product, or service with noticeable failure risks, the method assesses possible failure modes in advance. It directs attention to combinations of occurrence, effect, and detectability. |
Complexitydifferent | Low | Medium | Medium | High |
Timedifferent | 30-60 min | 1-2 h | 60-90 min | 2-6 h |
Participantsdifferent | 2-8 | 4-12 | 3-6 | 3-10 |
Formatsame | Workshop | Workshop | Workshop | Workshop |
Outputdifferent | Fishbone Diagram, Cause Categories, Investigation Backlog | Alignment Map, Open Issues, Decision Questions | Salience Diagram, Strategy per Class | FMEA Table, Risk Priority, Mitigation Actions |
Tagsno overlap | Root causeQualityOperations | AlignmentStakeholdersStrategyFacilitation | StakeholdersFacilitationAlignmentGovernance | RiskQualityOperationsRoot cause |