View methods side by side.
Choose up to four methods. Add them using the search and share the comparison by copying its link.
| Criterion | 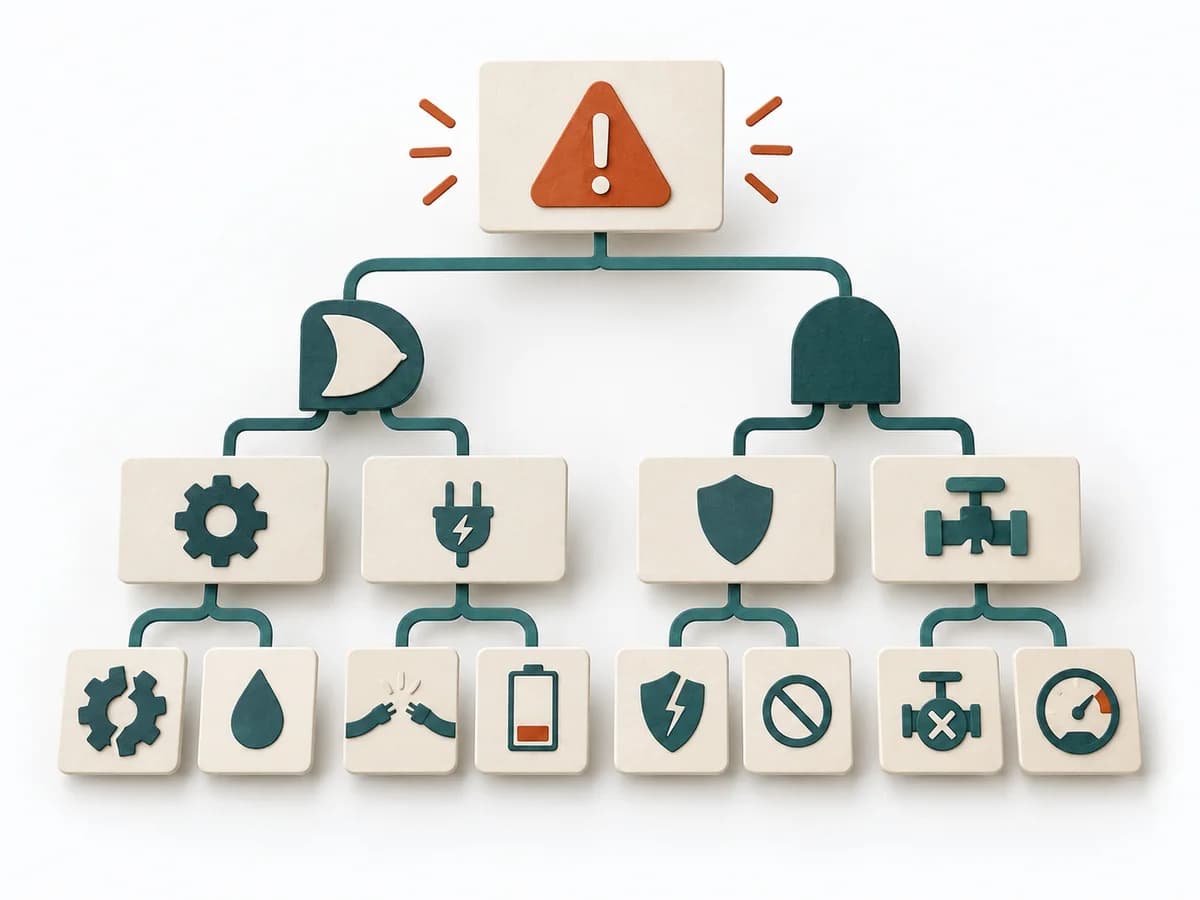 Operations Fault Tree Analysis |  Business Strategy Strategy Execution Loop |  Operations Fishbone Diagram |  Operations After-Action Review |
|---|---|---|---|---|
Purposedifferent | For a critical top event with several possible triggers, the method logically models failure paths. It makes visible which combinations of conditions can lead to damage. | The Strategy Execution Loop helps avoid treating strategy as a one-off document. It makes visible how strategic decisions are turned into objectives, initiatives, operational work, measurement, and learning. | When a problem has several possible contributing factors, the method sorts causes by cause areas. It prevents an initial hunch from blocking the view of other plausible drivers. | After missions or project phases with unclear outcomes, the method makes visible what actually happened and what can be learned from it. It separates course, effect, and causes so experience turns into solid improvement. |
Complexitydifferent | High | High | Low | Low |
Timedifferent | 2-6 h | Initial 3-6 h, then monthly or quarterly reviews | 30-60 min | 20-45 min |
Participantsdifferent | 3-8 | 5-12 | 2-8 | 3-12 |
Formatdifferent | Workshop + async | Workshop + async | Workshop | Workshop + async |
Outputdifferent | Fault Tree, Critical Paths, Cause Hypotheses, Control Actions | Execution Loop, Review Cadence, Strategic Learning Log | Fishbone Diagram, Cause Categories, Investigation Backlog | Lessons learned, Action items, Event summary |
Tagsno overlap | RiskRoot causeSafety | ExecutionCadenceLearningGovernance | Root causeQualityOperations | LearningOperationsImprovement |