View methods side by side.
Choose up to four methods. Add them using the search and share the comparison by copying its link.
| Criterion | 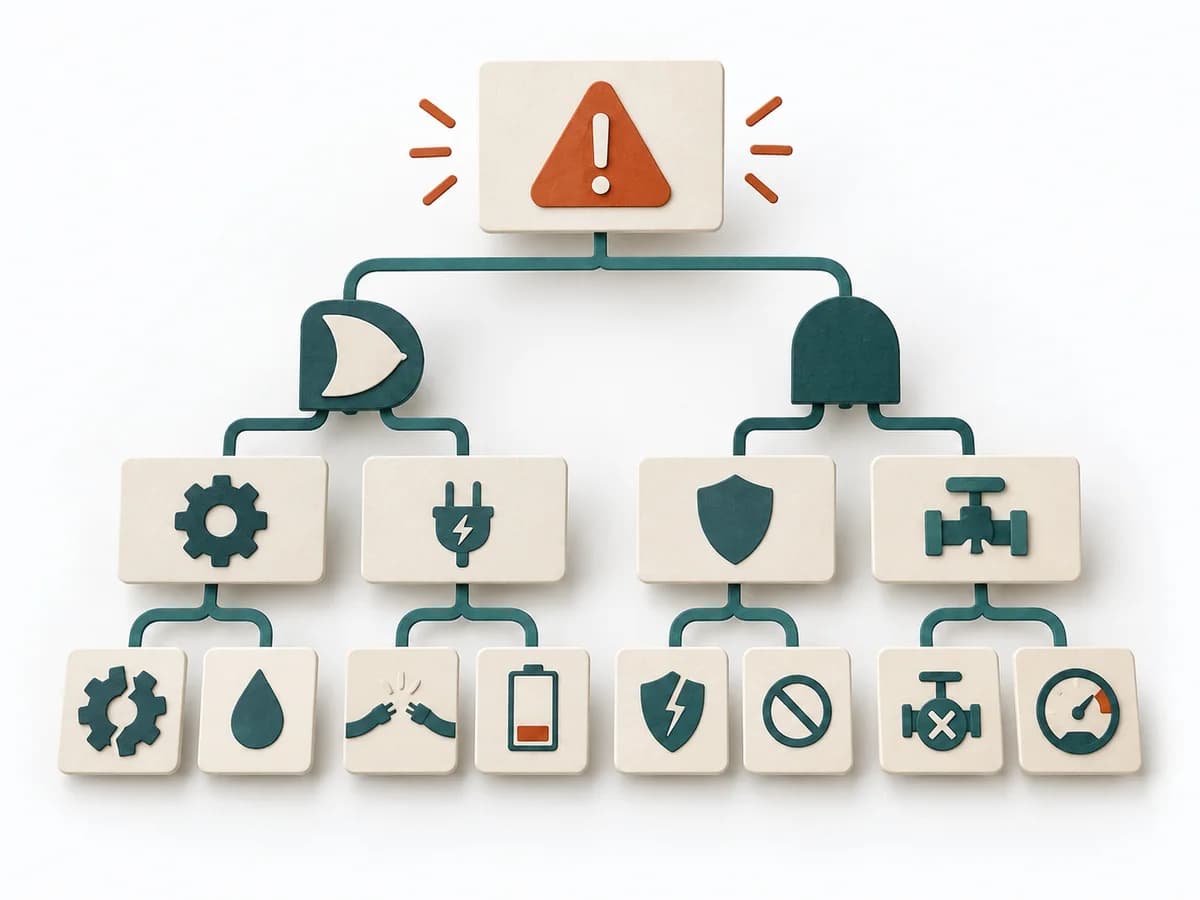 Operations Fault Tree Analysis | 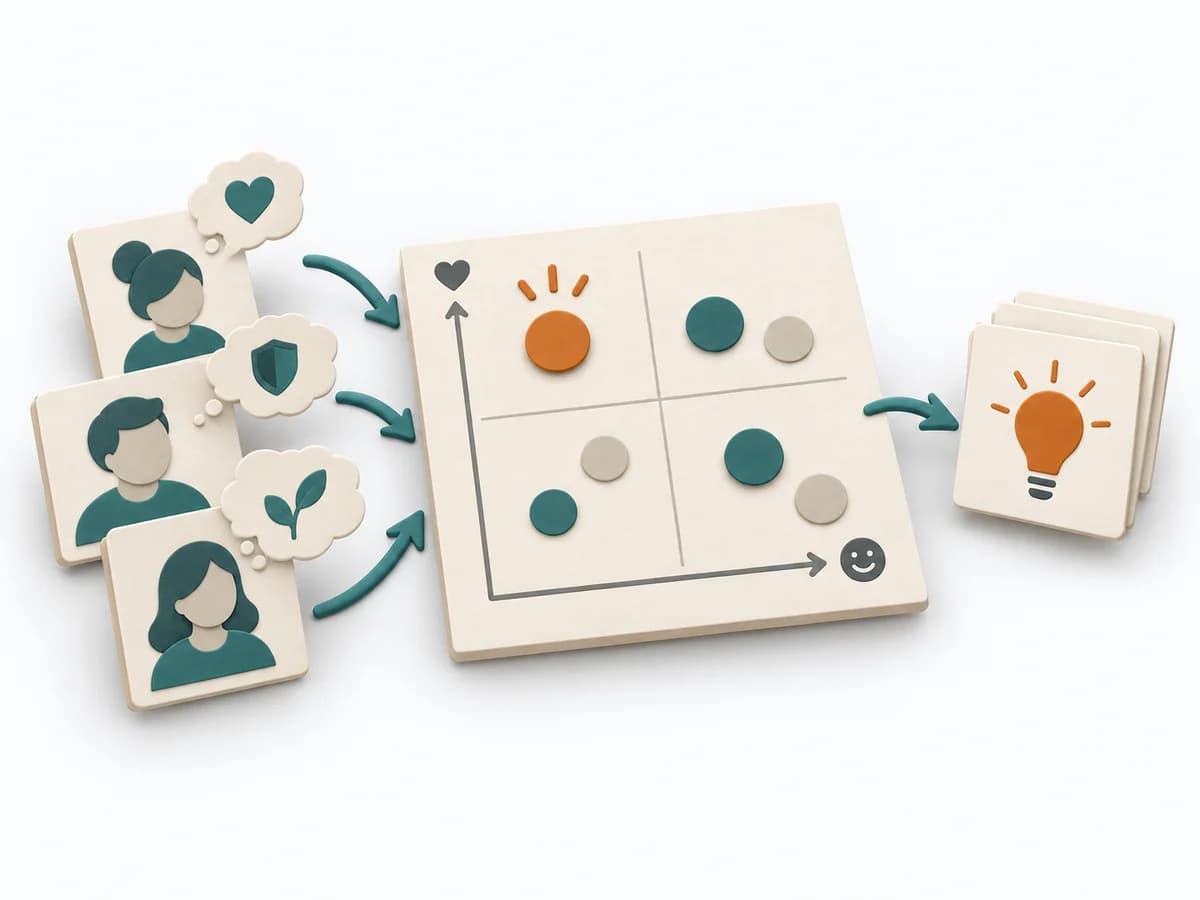 Product Discovery Outcome-Driven Innovation |  Product Discovery Smoke Test |  Growth A/B Testing |
|---|---|---|---|---|
Purposedifferent | For a critical top event with several possible triggers, the method logically models failure paths. It makes visible which combinations of conditions can lead to damage. | Outcome-Driven Innovation clarifies customer problems, solution opportunities, and evidence. It separates jobs, desired outcomes, importance, satisfaction, and opportunity, and captures results as desired outcome statements, an opportunity landscape, and segments by underserved needs. | When demand only needs to be roughly verified, it tests interest with minimal effort. It measures whether people would take a next step at all. | When two variants compete, discussions quickly decide by taste rather than effect. A/B Testing checks behavior under controlled conditions and separates real improvement from chance or expectation effects. |
Complexitydifferent | High | High | Low | High |
Timedifferent | 2-6 h | Mehrere Wochen | 1-5 Tage | 1-4 Wochen |
Participantsdifferent | 3-8 | 2-6 researchers plus sample | Nutzertraffic | 1-6 |
Formatdifferent | Workshop + async | Workshop + async | Async | Async |
Outputdifferent | Fault Tree, Critical Paths, Cause Hypotheses, Control Actions | Desired outcome statements, Opportunity landscape, Segmentation by underserved needs, Innovation hypotheses | Interest Metrics, Conversion Signal, Learning Note | Experiment results, Decision log, Learning summary |
Tagsno overlap | RiskRoot causeSafety | OutcomesInnovationResearchQuantitative | ValidationExperimentsDemandGrowth | ExperimentsGrowthAnalyticsValidation |