View methods side by side.
Choose up to four methods. Add them using the search and share the comparison by copying its link.
| Criterion | 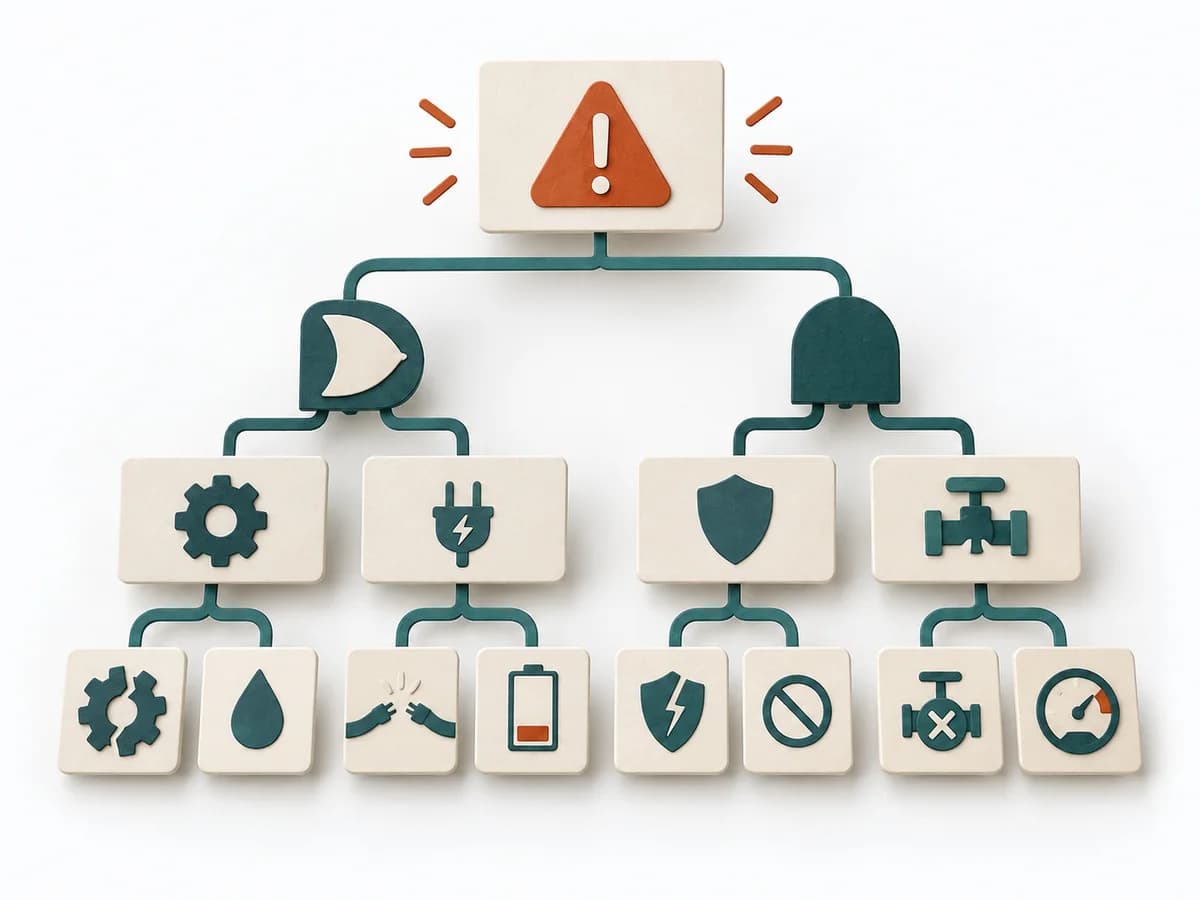 Operations Fault Tree Analysis |  Agile Ideal Days |  Operations Failure Mode and Effects Analysis |  Facilitation Dot Estimation |
|---|---|---|---|---|
Purposedifferent | For a critical top event with several possible triggers, the method logically models failure paths. It makes visible which combinations of conditions can lead to damage. | When effort needs to be thought of as real working time, it offers a simple common denominator for comparison. It sorts work by value, risk, and delivery ability. The result is captured as Ideal Day Estimates, Assumption Notes, and Capacity Caveats. | For a process, product, or service with noticeable failure risks, the method assesses possible failure modes in advance. It directs attention to combinations of occurrence, effect, and detectability. | When size or effort can only be estimated roughly, Dot Estimation condenses the group's experience into a quick range. It turns individual contributions into a visible selection. The result is captured as an Effort Heatmap, Risk Signals, and Discussion Targets. |
Complexitydifferent | High | Low | High | Low |
Timedifferent | 2-6 h | 15-60 min | 2-6 h | 5-20 min |
Participantsdifferent | 3-8 | 2-9 | 3-10 | 3-20 |
Formatdifferent | Workshop + async | Workshop + async | Workshop | Workshop |
Outputdifferent | Fault Tree, Critical Paths, Cause Hypotheses, Control Actions | Ideal Day Estimates, Assumption Notes, Capacity Caveats | FMEA Table, Risk Priority, Mitigation Actions | Effort Heatmap, Risk Signals, Discussion Targets |
Tagsno overlap | RiskRoot causeSafety | EstimationEffortAgile | RiskQualityOperationsRoot cause | EstimationEffortRisk |