View methods side by side.
Choose up to four methods. Add them using the search and share the comparison by copying its link.
| Criterion | 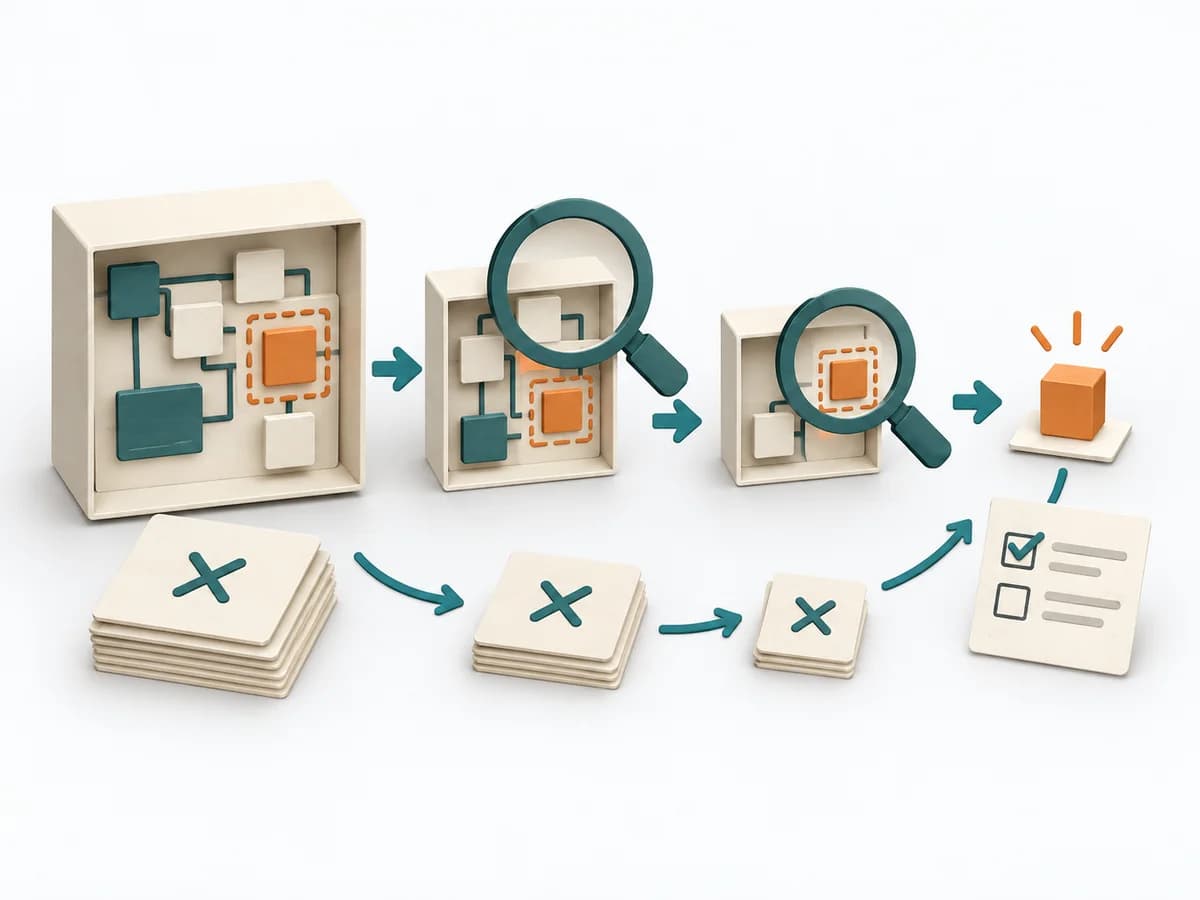 Engineering Fault Isolation |  Product Strategy KPI Tree | 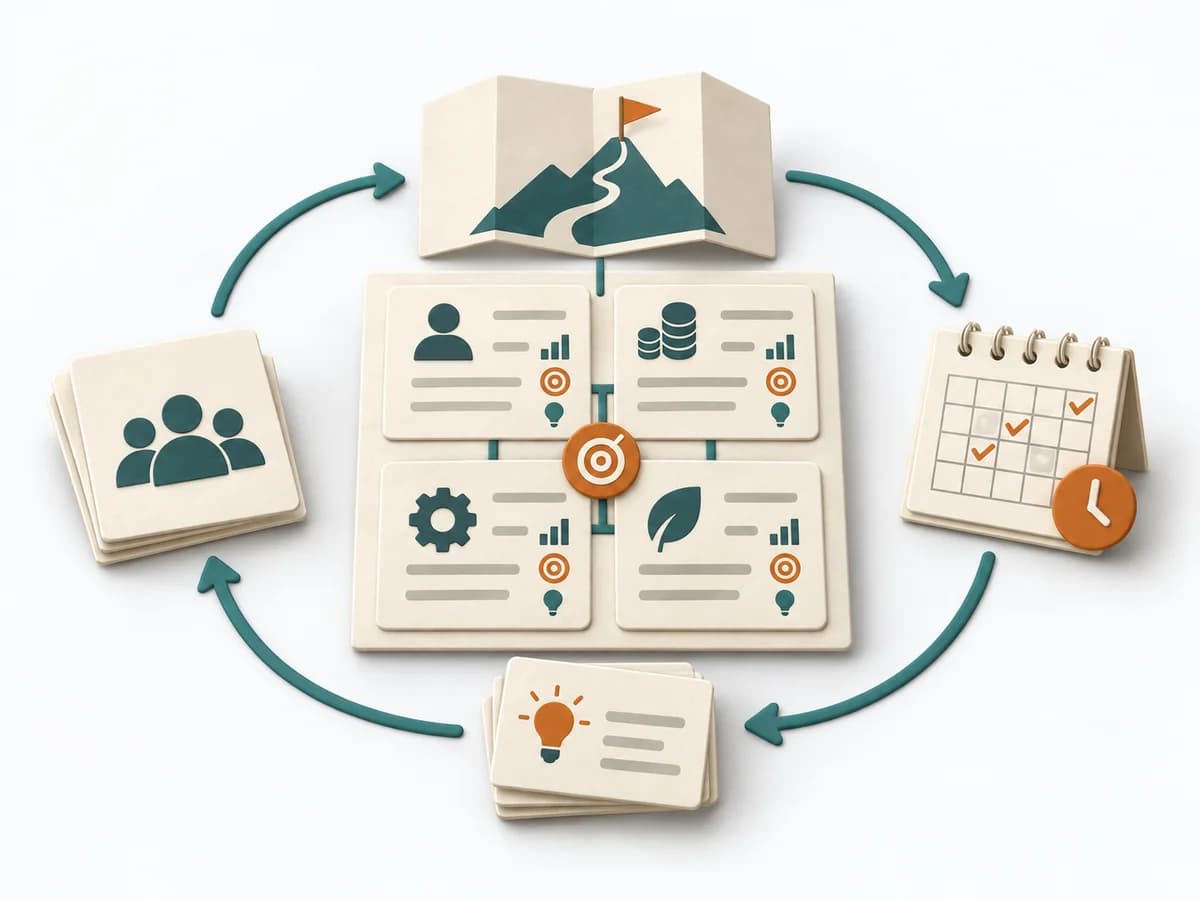 Business Strategy Balanced Scorecard |  Facilitation Alignment Mapping |
|---|---|---|---|---|
Purposedifferent | In technical failures, the visible symptom often gets mixed up with the actual cause. Fault Isolation narrows the fault space and progressively reduces which part of the system is truly affected. | When metrics across the organization drift apart, it arranges drivers and effects under one shared logic. It connects customer value, product logic, and decision priorities. The result is captured as a KPI tree and owner list. | Balanced Scorecard translates strategy into a few interconnected perspectives and metrics. It holds impact, steering, and learning together in daily work instead of narrowing strategy down to financial figures. | When several people work toward one goal but hold different mental maps, Alignment Mapping makes the discrepancies visible. It arranges goals, assumptions, and priorities so shared direction becomes verifiable. |
Complexitydifferent | Medium | Medium | High | Medium |
Timedifferent | 30-180 min | 90-180 min initial, dann laufend | Halber Tag bis mehrere Wochen | 1-2 h |
Participantsdifferent | 1-6 | 3-8 | 4-12 | 4-12 |
Formatdifferent | Workshop + async | Workshop + async | Workshop + async | Workshop |
Outputdifferent | Fault Isolation Map, Test Log, Excluded Hypotheses, Narrowed Fault Area | KPI Tree, Owner List | Balanced Scorecard, Strategic Measures, Initiative Map | Alignment Map, Open Issues, Decision Questions |
Tagsno overlap | TroubleshootingDiagnosisEngineering | MetricsStrategyAlignmentMeasurement | StrategyMetricsExecution | AlignmentStakeholdersStrategyFacilitation |