View methods side by side.
Choose up to four methods. Add them using the search and share the comparison by copying its link.
| Criterion | 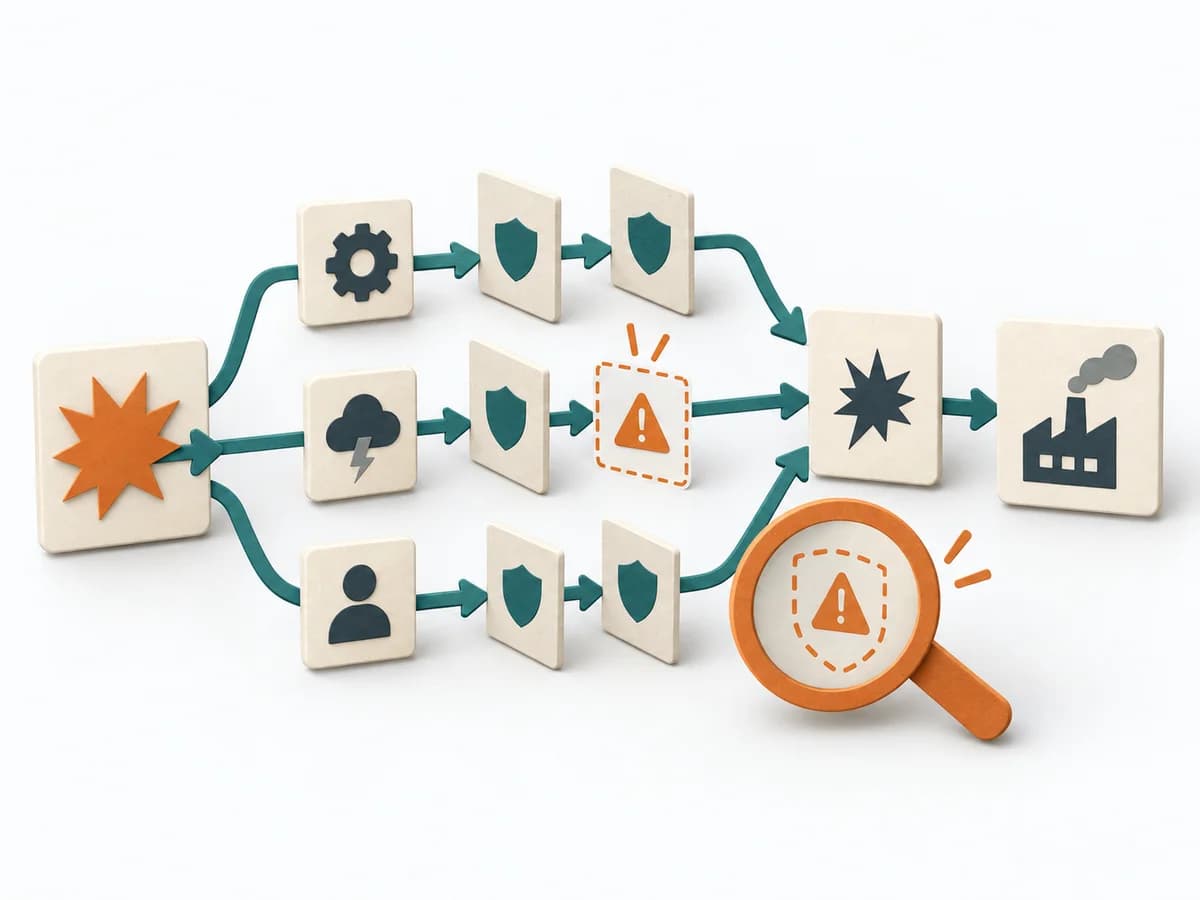 Engineering Failure Scenario Analysis |  Product Strategy Counter Metrics |
|---|---|---|
Purposedifferent | In critical processes, it is not enough to plan only for the normal case. Failure Scenario Analysis looks at the path into failure and shows which failures, chains, and control gaps cause the most damage. | When a headline metric could mask side effects, it adds guardrail signals against unwanted outcomes. It connects customer value, product logic, and decision priorities. The result is captured as a counter-metric list and guardrail definitions. |
Complexitydifferent | Medium | Low |
Timedifferent | 1-3 h | 30-60 min |
Participantsdifferent | 3-8 | 2-6 |
Formatdifferent | Workshop | Workshop + async |
Outputdifferent | Failure Scenarios, Risk Notes, Control Gaps, Test and Response Actions | Counter Metric List, Guardrail Definitions |
Tagsno overlap | FailureResilienceRisk | MetricsMeasurementStrategyExperiments |
Often compared together
Methods with strong topical overlap with the current selection, not yet in the comparison.