View methods side by side.
Choose up to four methods. Add them using the search and share the comparison by copying its link.
| Criterion | 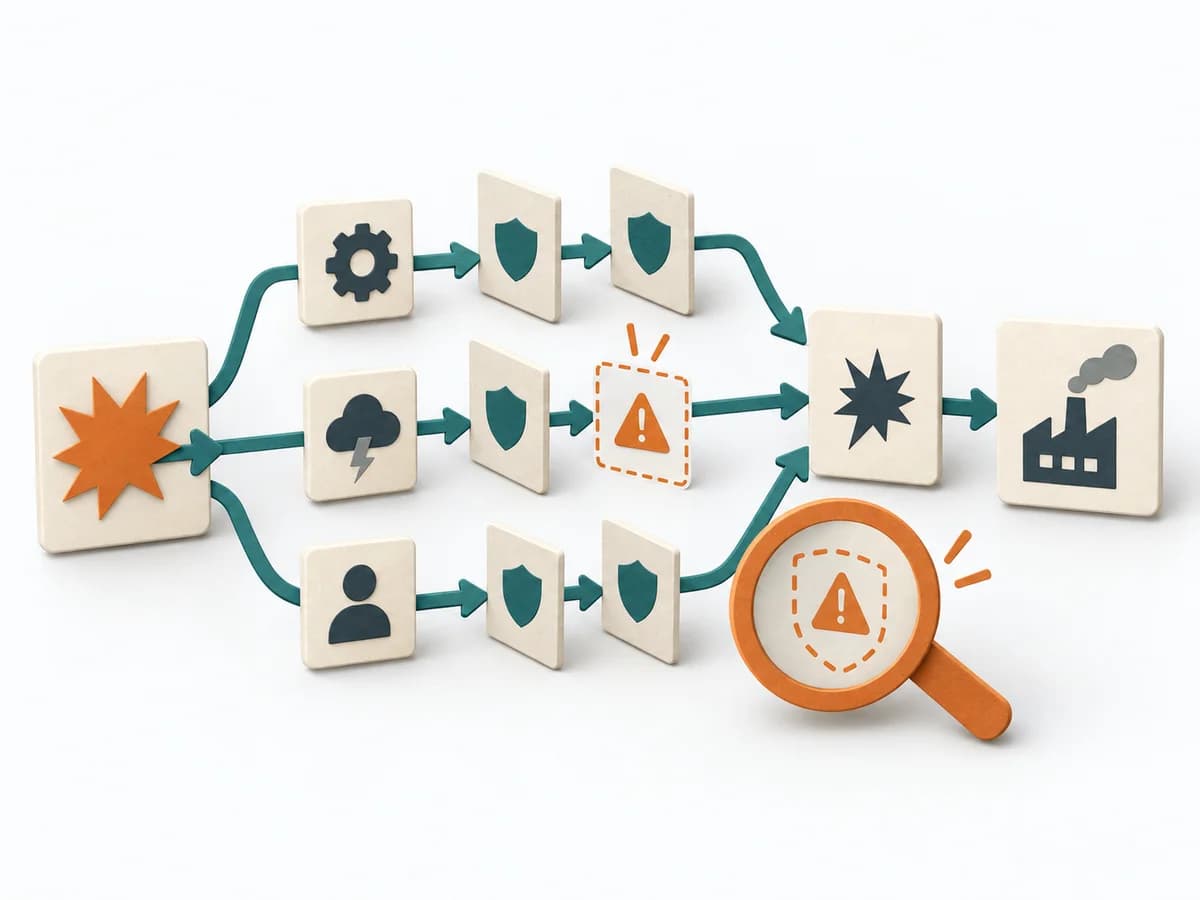 Engineering Failure Scenario Analysis |  Operations ABC Analysis |  Operations Failure Mode and Effects Analysis |
|---|---|---|---|
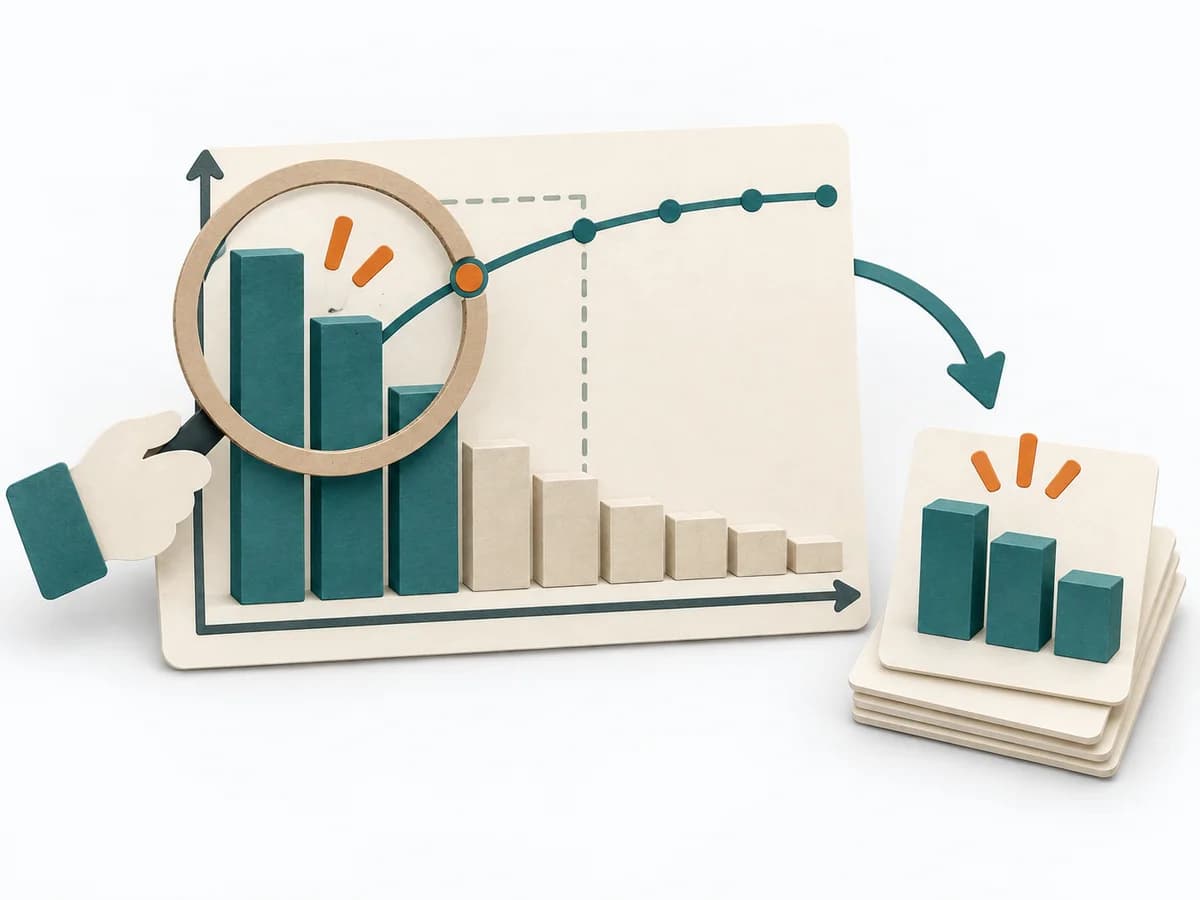
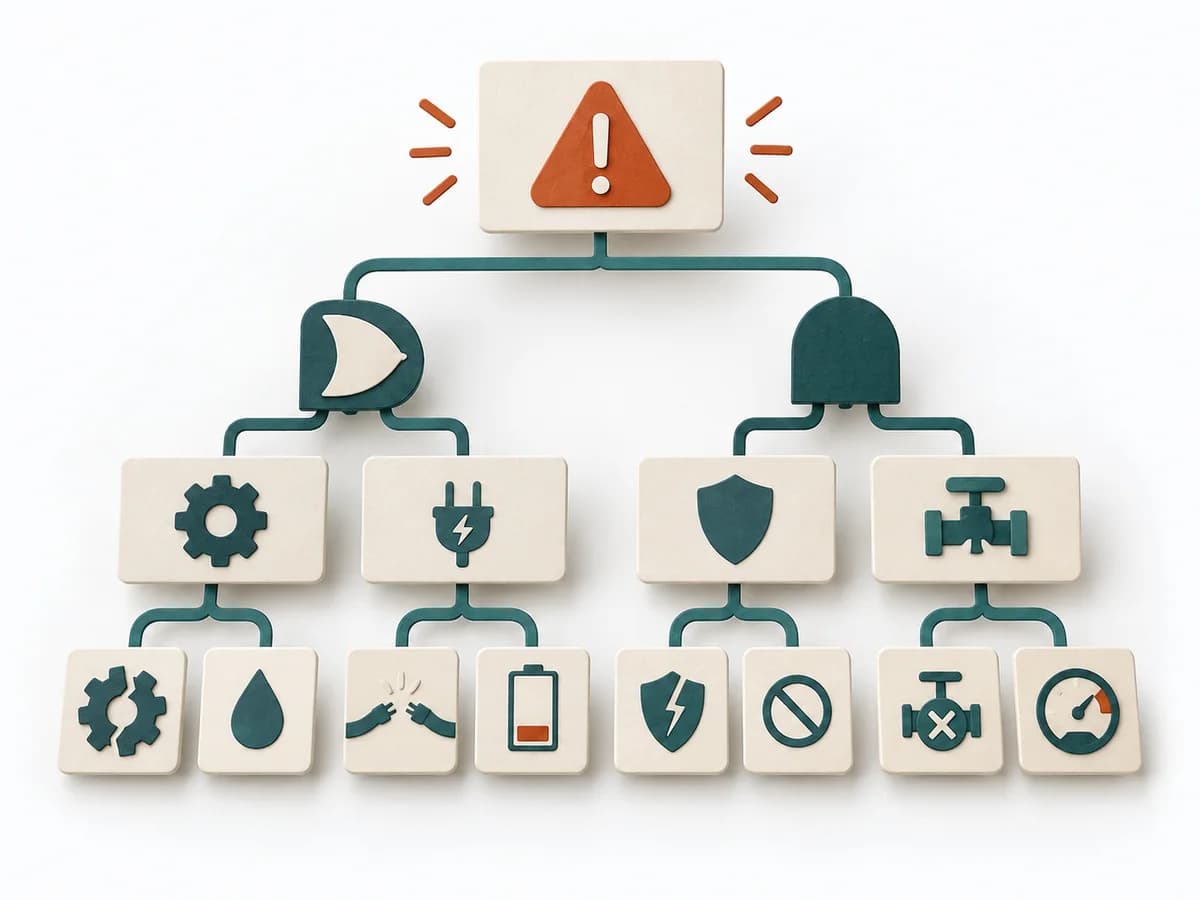
Purposedifferent | In critical processes, it is not enough to plan only for the normal case. Failure Scenario Analysis looks at the path into failure and shows which failures, chains, and control gaps cause the most damage. | With many similar objects of differing economic significance, the method prioritizes effort by effect. It separates what needs regular steering from what rarely needs attention. | For a process, product, or service with noticeable failure risks, the method assesses possible failure modes in advance. It directs attention to combinations of occurrence, effect, and detectability. |
Complexitydifferent | Medium | Low | High |
Timedifferent | 1-3 h | 30-60 min | 2-6 h |
Participantsdifferent | 3-8 | 1-5 | 3-10 |
Formatdifferent | Workshop | Async | Workshop |
Outputdifferent | Failure Scenarios, Risk Notes, Control Gaps, Test and Response Actions | ABC Classification, Focus Rules, Control List | FMEA Table, Risk Priority, Mitigation Actions |
Tagsno overlap | FailureResilienceRisk | PrioritizationOperationsPortfolio | RiskQualityOperationsRoot cause |
Often compared together
Methods with strong topical overlap with the current selection, not yet in the comparison.