View methods side by side.
Choose up to four methods. Add them using the search and share the comparison by copying its link.
| Criterion |  Facilitation Expectation Mapping |  Operations PDCA Cycle |  Facilitation 3-Circle Venn Diagram | 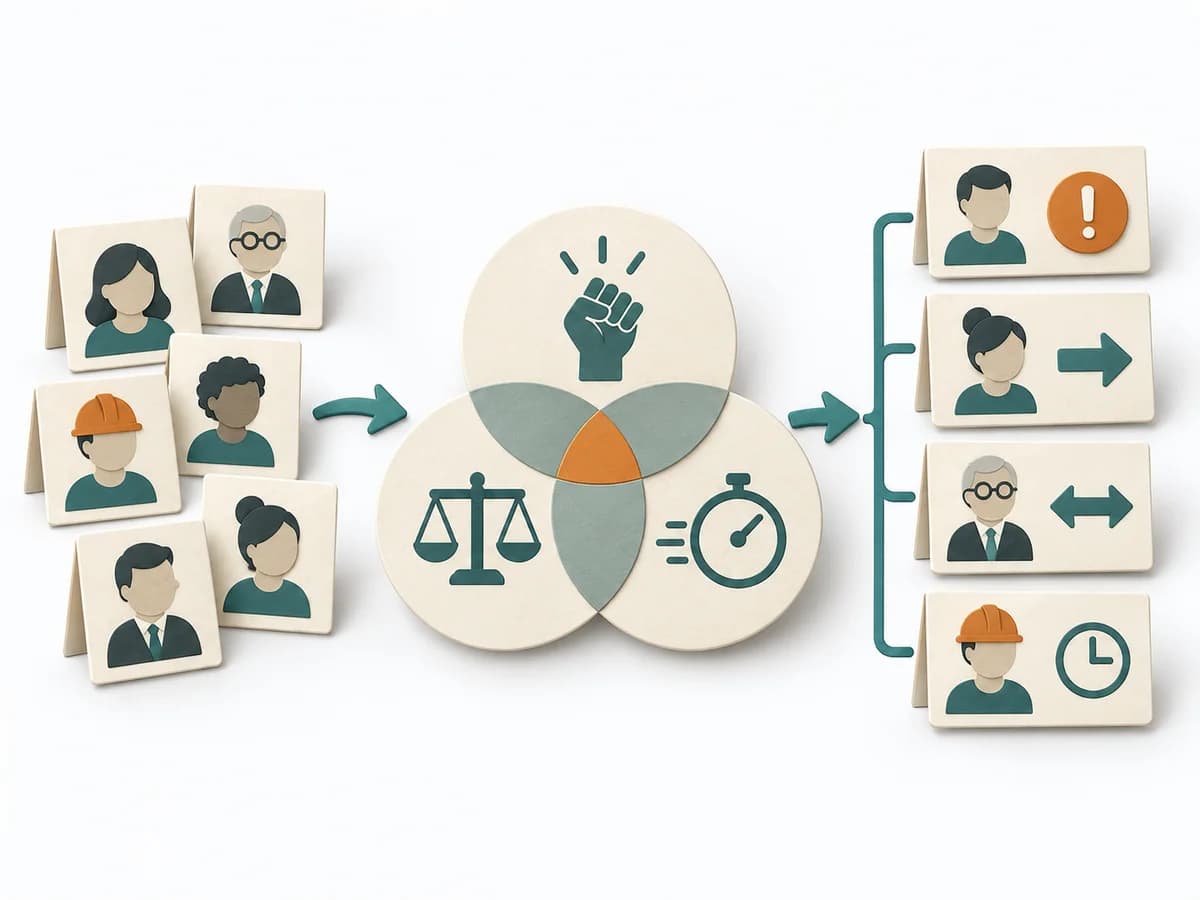 Facilitation Stakeholder Salience Model |
|---|---|---|---|---|
Purposedifferent | When roles, interfaces, or projects fail because of differing expectations, Expectation Mapping surfaces these differences. It shows what each side takes for granted and where the pictures diverge. | For an improvement that still has to prove itself in everyday work, the method runs it through small learning loops. It connects planning, checking, and standardization into a repeatable learning mode. | When three perspectives matter at the same time, a Three-Circle Venn Diagram shows the overlaps and remainders precisely. It makes visible where shared effect arises and where only a partial perspective applies. | When stakeholders appear to matter very differently, the Stakeholder Salience Model rates their actual priority through power, legitimacy, and urgency. It turns individual contributions into a visible selection. The result is captured as a Salience diagram and a class-based strategy. |
Complexitydifferent | Low | Low | Low | Medium |
Timedifferent | 45-90 min | 1 h bis mehrere Wochen | 15-45 min | 60-90 min |
Participantsdifferent | 3-12 | 1-8 | 2-8 | 3-6 |
Formatdifferent | Workshop | Workshop + async | Workshop + async | Workshop |
Outputdifferent | Expectation Map, Alignment Notes, Agreements | PDCA Log, Experiment Plan, Learning Outcome, Standard Change | Venn Diagram, Overlap Notes, Differentiators | Salience Diagram, Strategy per Class |
Tagsno overlap | AlignmentStakeholdersTeam | Continuous improvementLeanExperiments | ComparisonFacilitationAlignment | StakeholdersFacilitationAlignmentGovernance |