View methods side by side.
Choose up to four methods. Add them using the search and share the comparison by copying its link.
| Criterion | 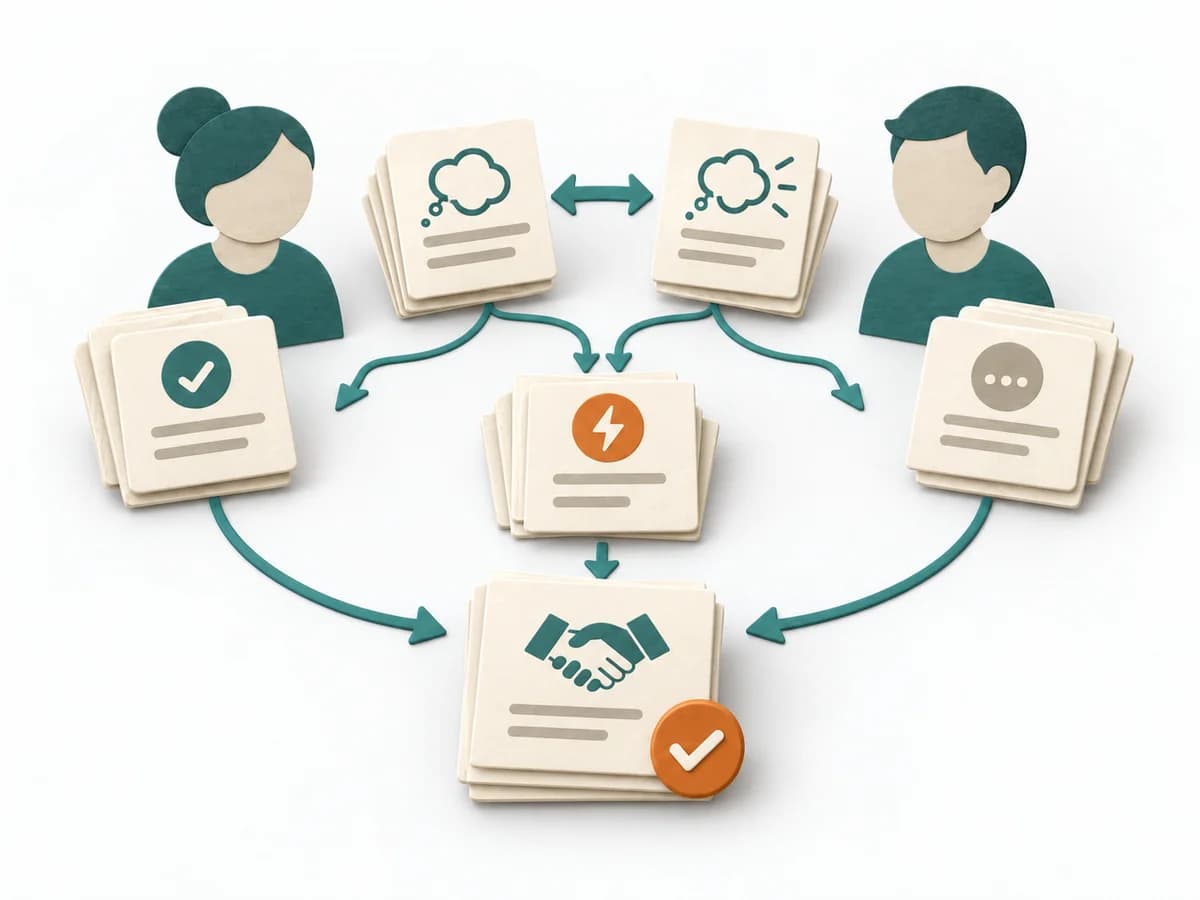 Facilitation Expectation Mapping |  Facilitation Dot Estimation |  Facilitation Power Interest Grid |  Facilitation Stakeholder Mapping |
|---|---|---|---|---|
Purposedifferent | When roles, interfaces, or projects fail because of differing expectations, Expectation Mapping surfaces these differences. It shows what each side takes for granted and where the pictures diverge. | When size or effort can only be estimated roughly, Dot Estimation condenses the group's experience into a quick range. It turns individual contributions into a visible selection. The result is captured as an Effort Heatmap, Risk Signals, and Discussion Targets. | When many stakeholders compete for attention at once, the Power Interest Grid sorts them by influence and stake. It turns individual contributions into a visible selection. The result is captured as a Power Interest Grid and a stakeholder-specific strategy. | When an initiative depends on many people, interests, and power dynamics, Stakeholder Mapping systematically orders the environment. It shows who influences, who is affected, and where relationship management or safeguarding matters first. |
Complexitysame | Low | Low | Low | Low |
Timedifferent | 45-90 min | 5-20 min | 30-60 min | 60–90 min |
Participantsdifferent | 3-12 | 3-20 | 2-8 | 2-8 |
Formatdifferent | Workshop | Workshop | Workshop | Workshop + async |
Outputdifferent | Expectation Map, Alignment Notes, Agreements | Effort Heatmap, Risk Signals, Discussion Targets | Power Interest Grid, Strategy per Stakeholder | Stakeholder Map, Engagement Plan, Risk Notes |
Tagsno overlap | AlignmentStakeholdersTeam | EstimationEffortRisk | StakeholdersFacilitationAlignmentPlanning | StakeholdersAlignmentFacilitationChange |