View methods side by side.
Choose up to four methods. Add them using the search and share the comparison by copying its link.
| Criterion |  Facilitation Expectation Mapping |  UX Research Affinity Diagramming | 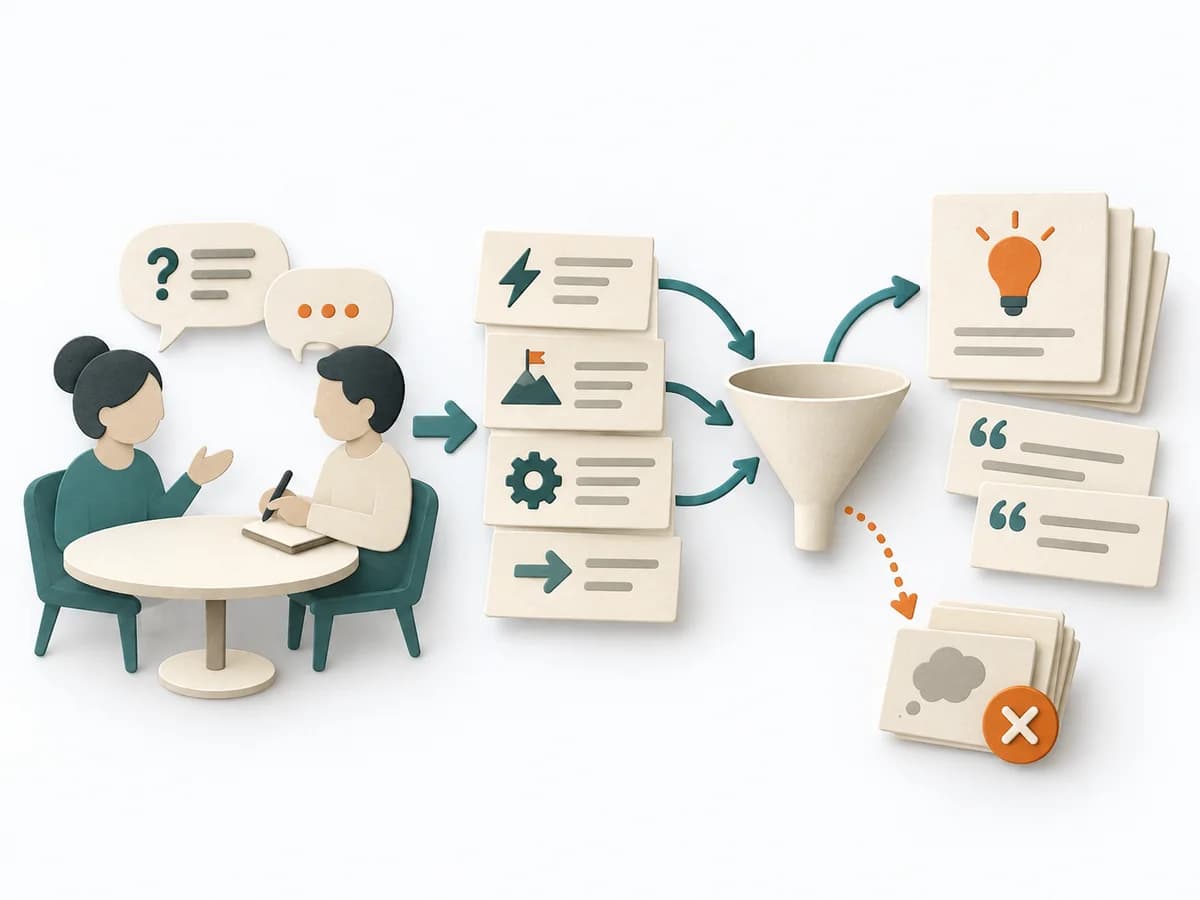 Product Discovery Opportunity Interview | 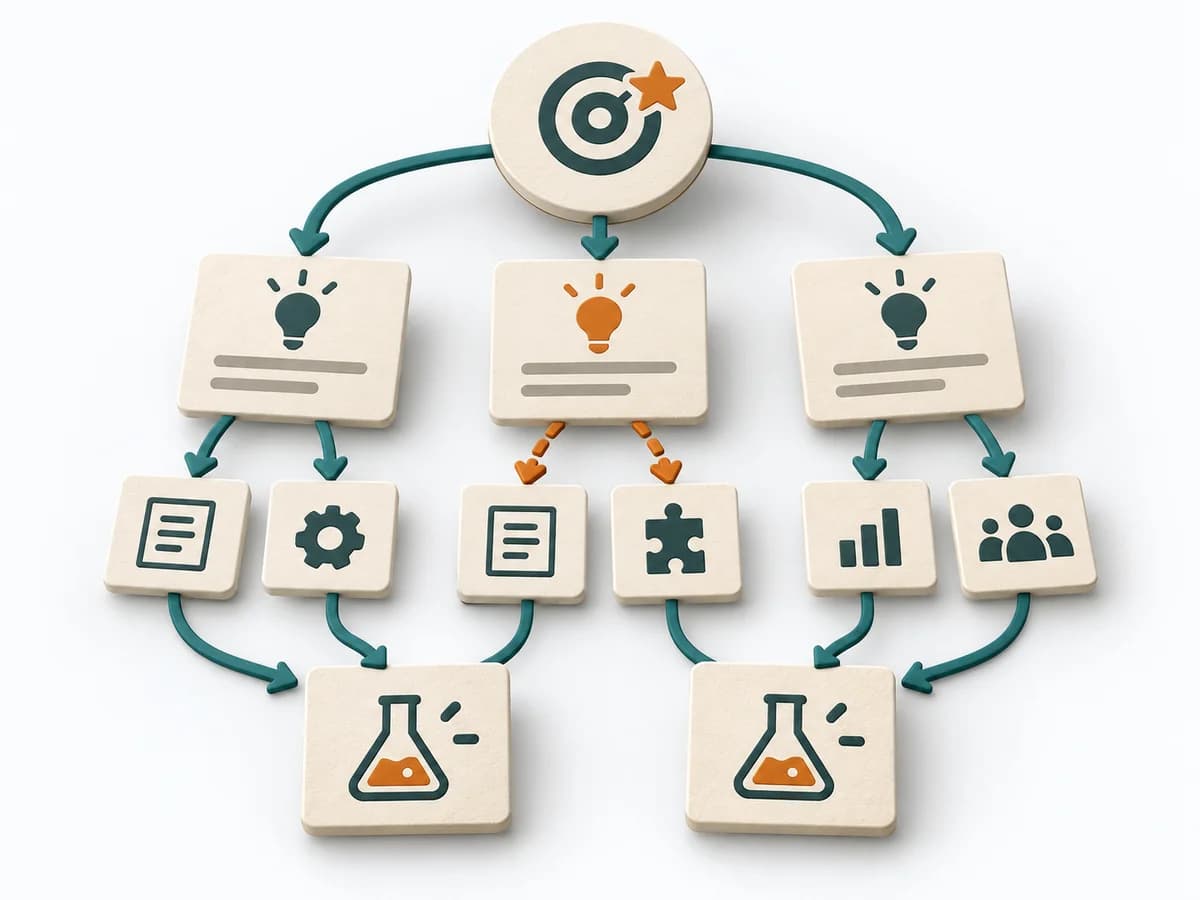 Product Discovery Opportunity Solution Tree |
|---|---|---|---|---|
Purposedifferent | When roles, interfaces, or projects fail because of differing expectations, Expectation Mapping surfaces these differences. It shows what each side takes for granted and where the pictures diverge. | When research notes, feedback, or observations sit unconnected side by side, affinity diagramming sorts the raw material into solid themes. Many individual points turn into patterns that make decisions and opportunities clearer. | When opportunities are still hidden behind signals of need, it structures conversations around needs and obstacles. It looks for patterns that lead to new product opportunities. | When discovery keeps swinging between goals, ideas, and learning loops, it creates clear steering logic. It connects the desired outcome, opportunities, and experiments into a legible structure. |
Complexitydifferent | Low | Low | Medium | Medium |
Timedifferent | 45-90 min | 45–90 min | 30-60 min je Interview | 1-2 h Setup, laufend |
Participantsdifferent | 3-12 | 3-10 | 5-12 Interviews | 2-6 |
Formatdifferent | Workshop | Workshop | Workshop + async | Workshop + async |
Outputdifferent | Expectation Map, Alignment Notes, Agreements | Theme clusters, Insight statements, Opportunity areas | Interview Notes, Opportunity Themes, Customer Quotes | Opportunity Solution Tree, Experiment Backlog, Learning Log |
Tagsno overlap | AlignmentStakeholdersTeam | SynthesisQualitativeRoot cause | DiscoveryInterviewsOpportunityCustomer | DiscoveryOutcomesExperimentsOpportunity |