View methods side by side.
Choose up to four methods. Add them using the search and share the comparison by copying its link.
| Criterion | 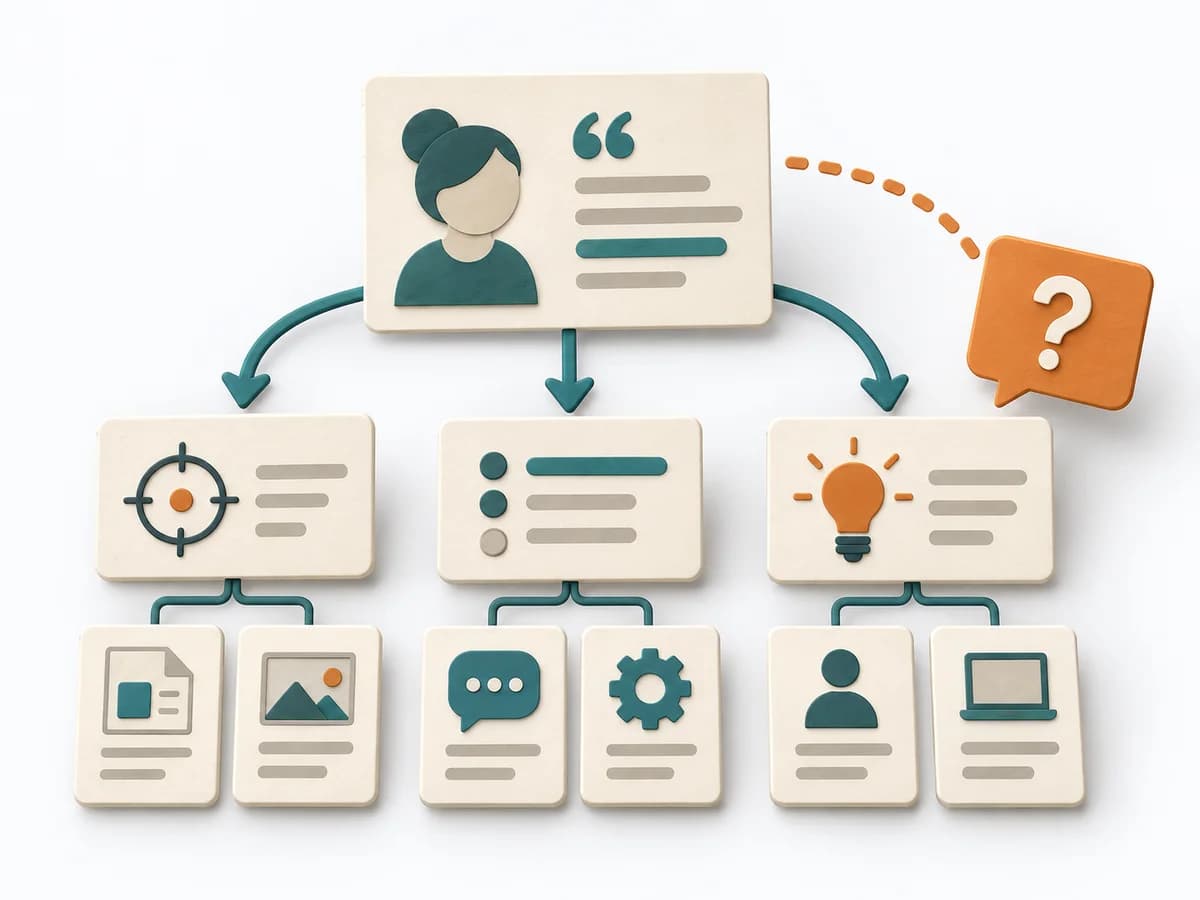 Agile Example Mapping | 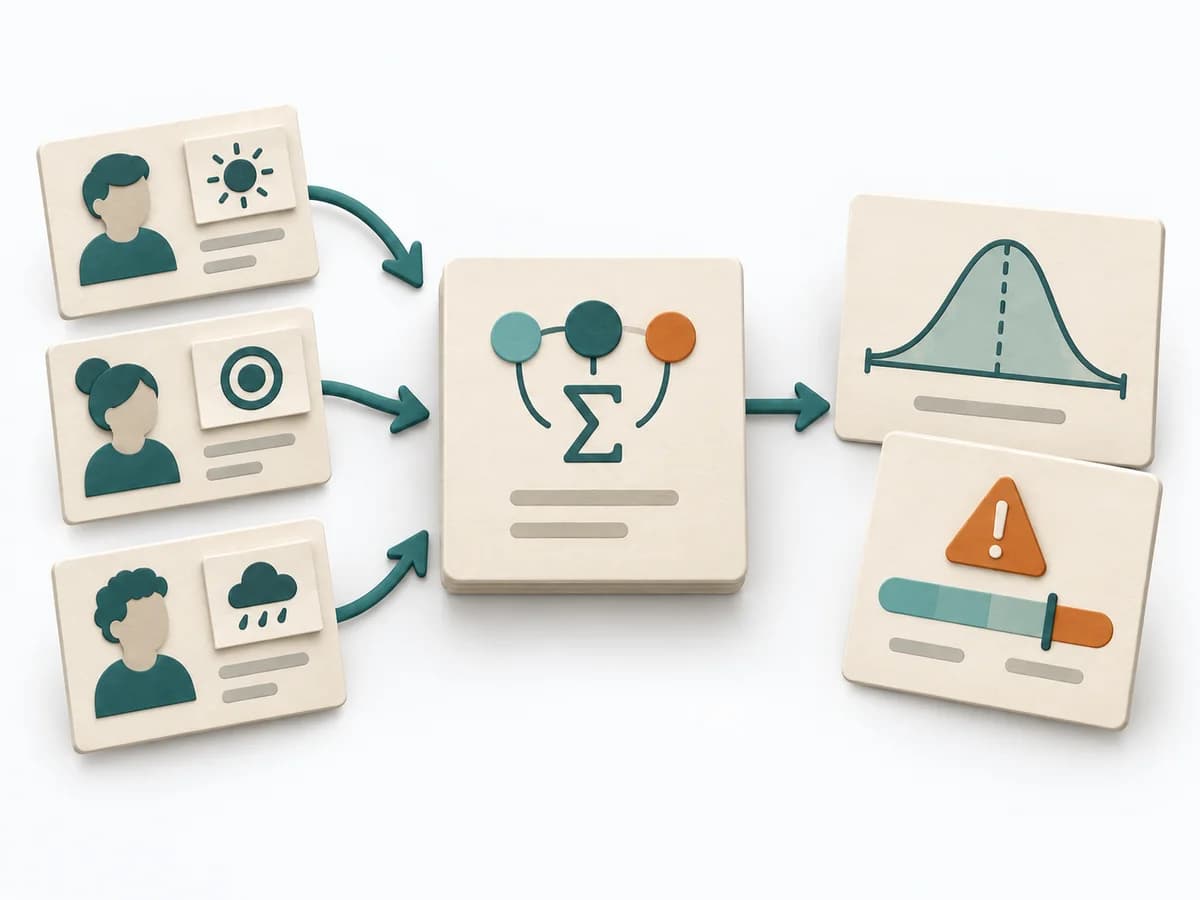 Decision Making PERT Estimation |  Operations Fishbone Diagram | 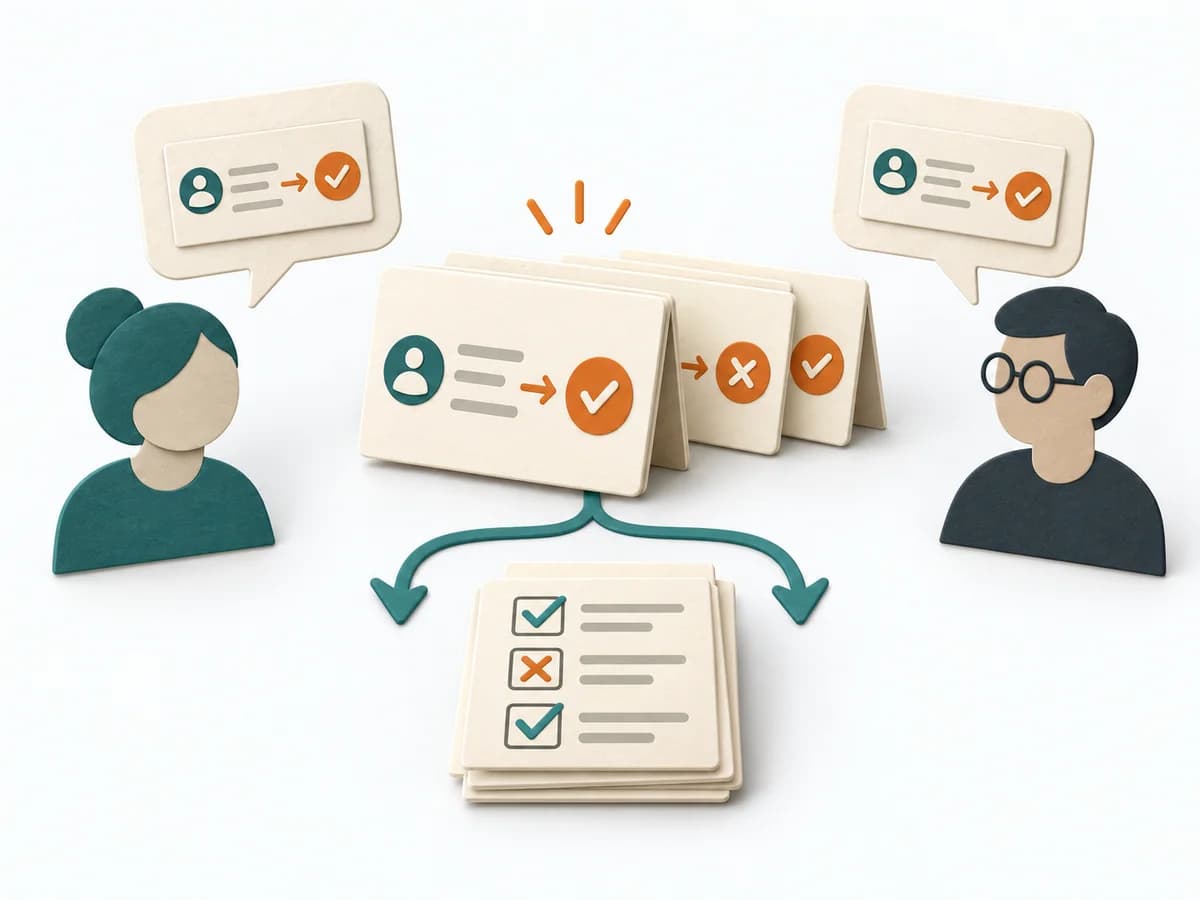 Agile Specification by Example |
|---|---|---|---|---|
Purposedifferent | When a story carries business rules and exceptions, it brings clarity before implementation. It makes examples, open questions, and boundaries visible enough that the logic becomes jointly sound. | On complex initiatives, a plain average tends to understate just how uncertain the outcome really is. It separates options, evaluation criteria, and open risks. The result is captured as a PERT Estimate, Expected Value, and Risk Notes. | When a problem has several possible contributing factors, the method sorts causes by cause areas. It prevents an initial hunch from blocking the view of other plausible drivers. | When business rules need to become precise, it ties language, example, and test together. It sorts work by value, risk, and delivery ability. The result is captured as an Example Table and Acceptance Tests. |
Complexitydifferent | Low | Medium | Low | Medium |
Timedifferent | 30-60 min | 15-45 min | 30-60 min | 60-90 min pro Feature |
Participantsdifferent | 3-7 | 1-8 | 2-8 | 3-6 |
Formatdifferent | Workshop | Workshop + async | Workshop | Workshop |
Outputdifferent | Example Map, Acceptance Criteria, Open Questions | PERT Estimate, Expected Value, Risk Notes | Fishbone Diagram, Cause Categories, Investigation Backlog | Example Table, Acceptance Tests |
Tagsno overlap | Behavior-Driven DevelopmentRequirementsExamplesRefinement | EstimationUncertaintyRisk | Root causeQualityOperations | AgileRequirementsExamplesBehavior-Driven Development |