View methods side by side.
Choose up to four methods. Add them using the search and share the comparison by copying its link.
| Criterion | 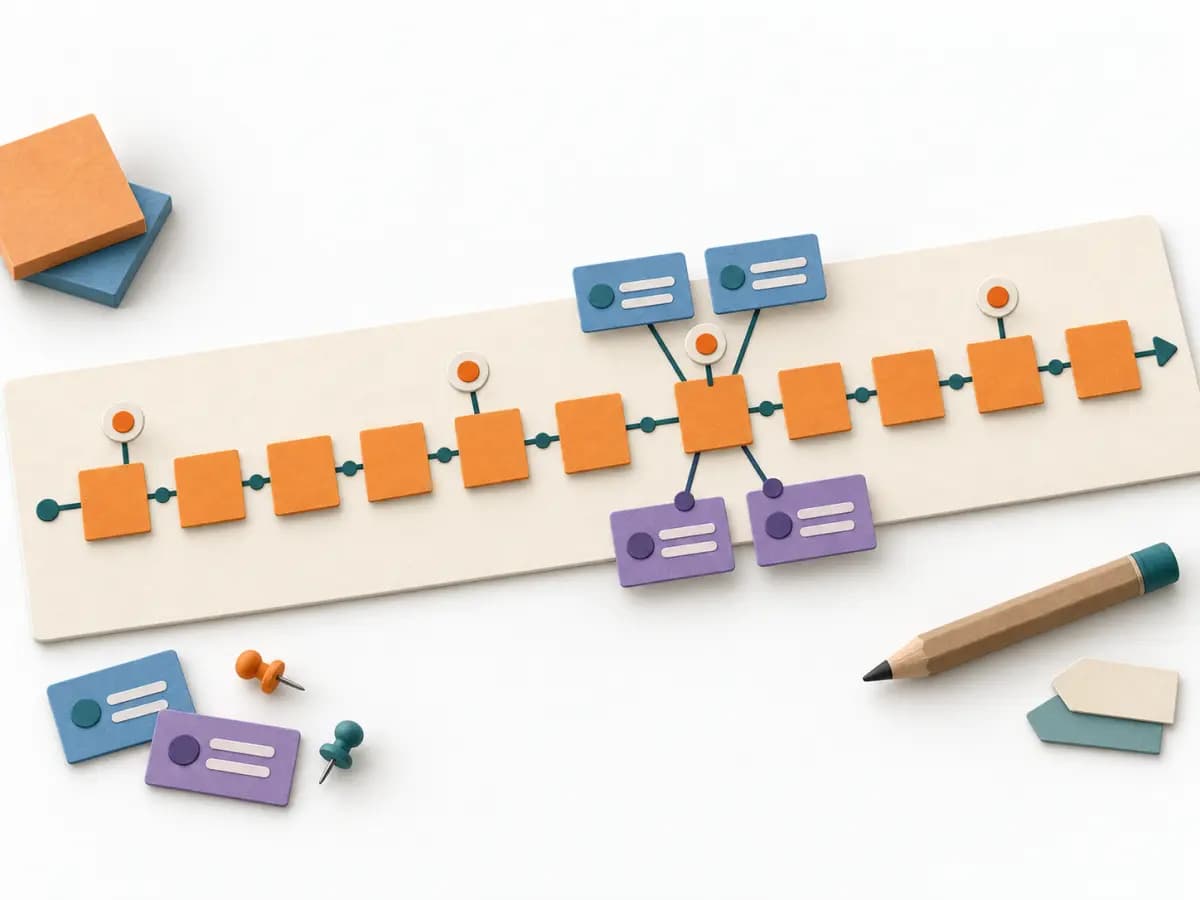 Domain Modeling EventStorming |  UX Research Empathy Mapping | 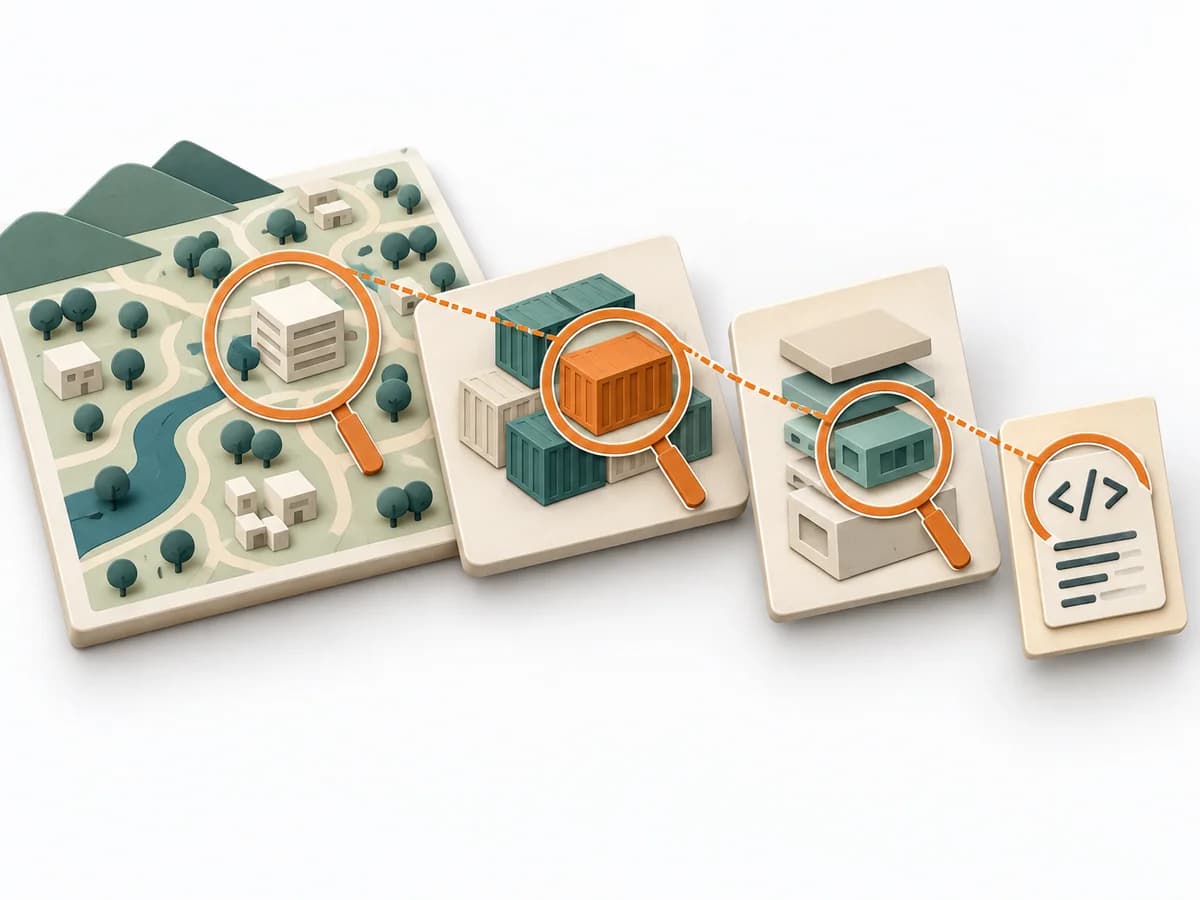 Architecture C4 Model |  UX Research Affinity Diagramming |
|---|---|---|---|---|
Purposedifferent | When a domain consists of many events, rules, and states, it creates a shared modeling space for the team. It bundles language, flows, and boundaries before domain knowledge fragments into siloed views. | When a lot is assumed about a target group but little is seen jointly, empathy mapping makes knowledge and gaps directly comparable. The picture also shows which assumptions hold up and where evidence is missing. | The C4 Model makes a system legible across several resolution levels, from context down to code. It suits situations where different audiences need to understand the same architecture from different altitudes. | When research notes, feedback, or observations sit unconnected side by side, affinity diagramming sorts the raw material into solid themes. Many individual points turn into patterns that make decisions and opportunities clearer. |
Complexitydifferent | Medium | Low | Low | Low |
Timedifferent | 2-8 h | 30–60 min | 1-4 h | 45–90 min |
Participantsdifferent | 5-12 | 4-8 | 1-5 | 3-10 |
Formatdifferent | Workshop | Workshop | Workshop + async | Workshop |
Outputdifferent | Event Timeline, Ubiquitous Language, Boundaries, Open Questions | Empathy Map, Assumptions List, Research Gaps | Context Diagram, Container Diagram, Component Diagram | Theme clusters, Insight statements, Opportunity areas |
Tagsno overlap | Domain-Driven DesignEventsDiscoveryWorkshop | SynthesisQualitativeWorkshop | ArchitectureCommunicationVisualization | SynthesisQualitativeRoot cause |