View methods side by side.
Choose up to four methods. Add them using the search and share the comparison by copying its link.
| Criterion | 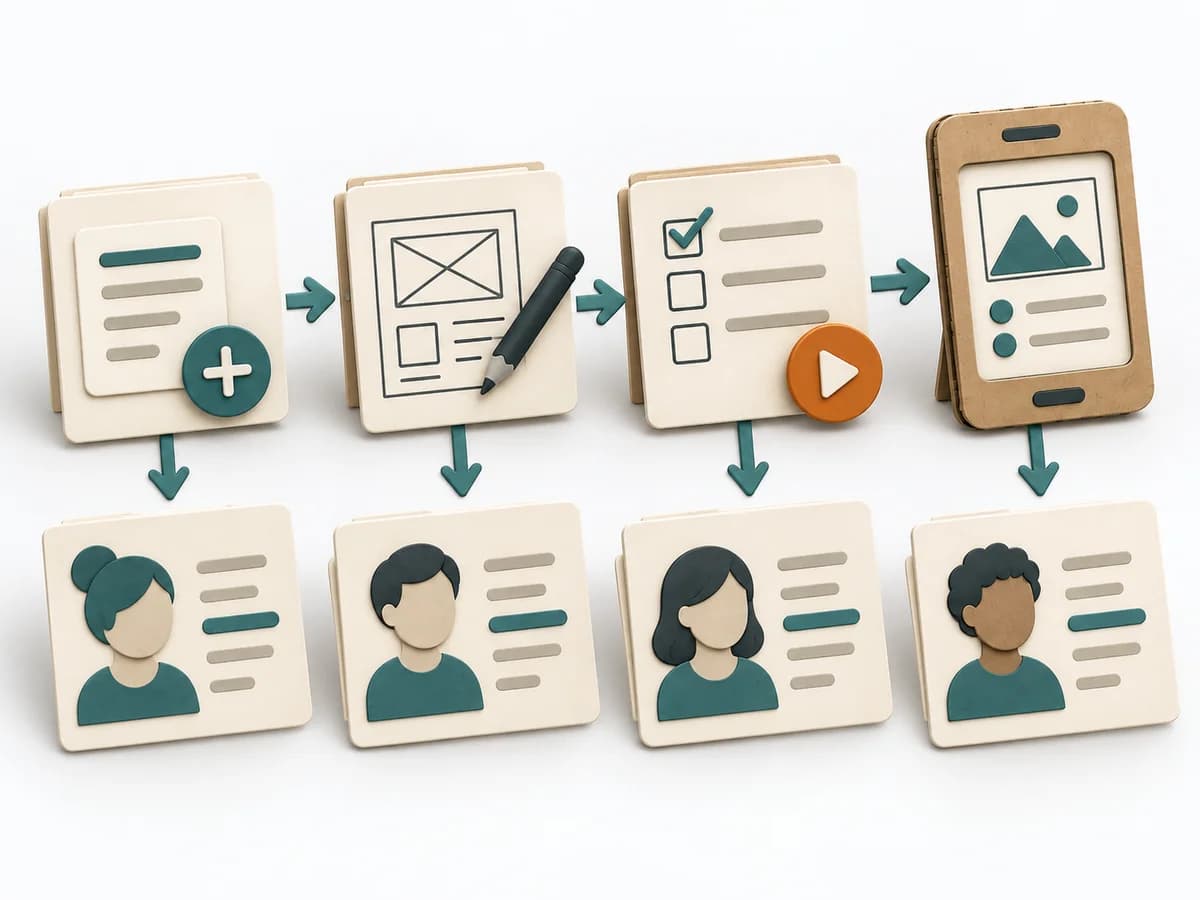 Knowledge Modeling Event Modeling |  Facilitation Alignment Mapping | 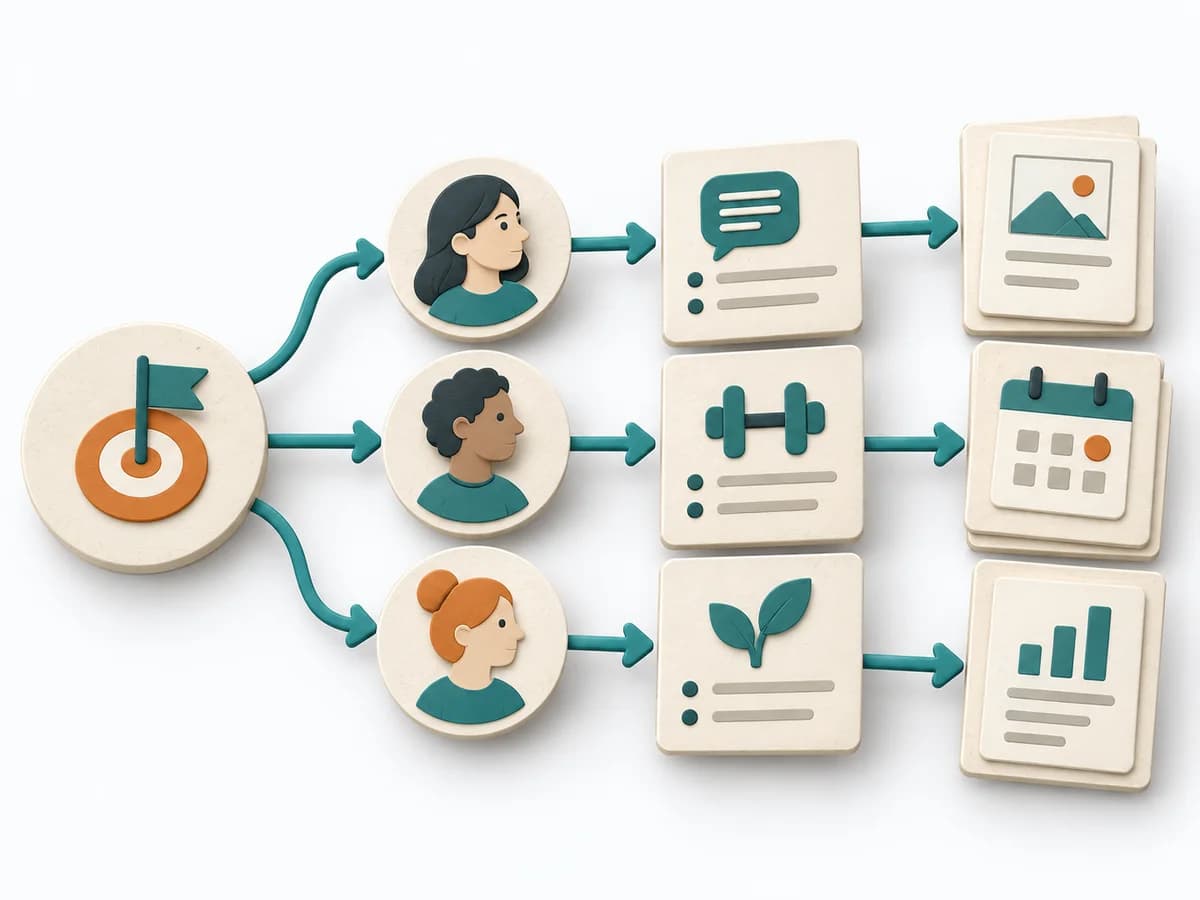 Product Strategy Impact Mapping | 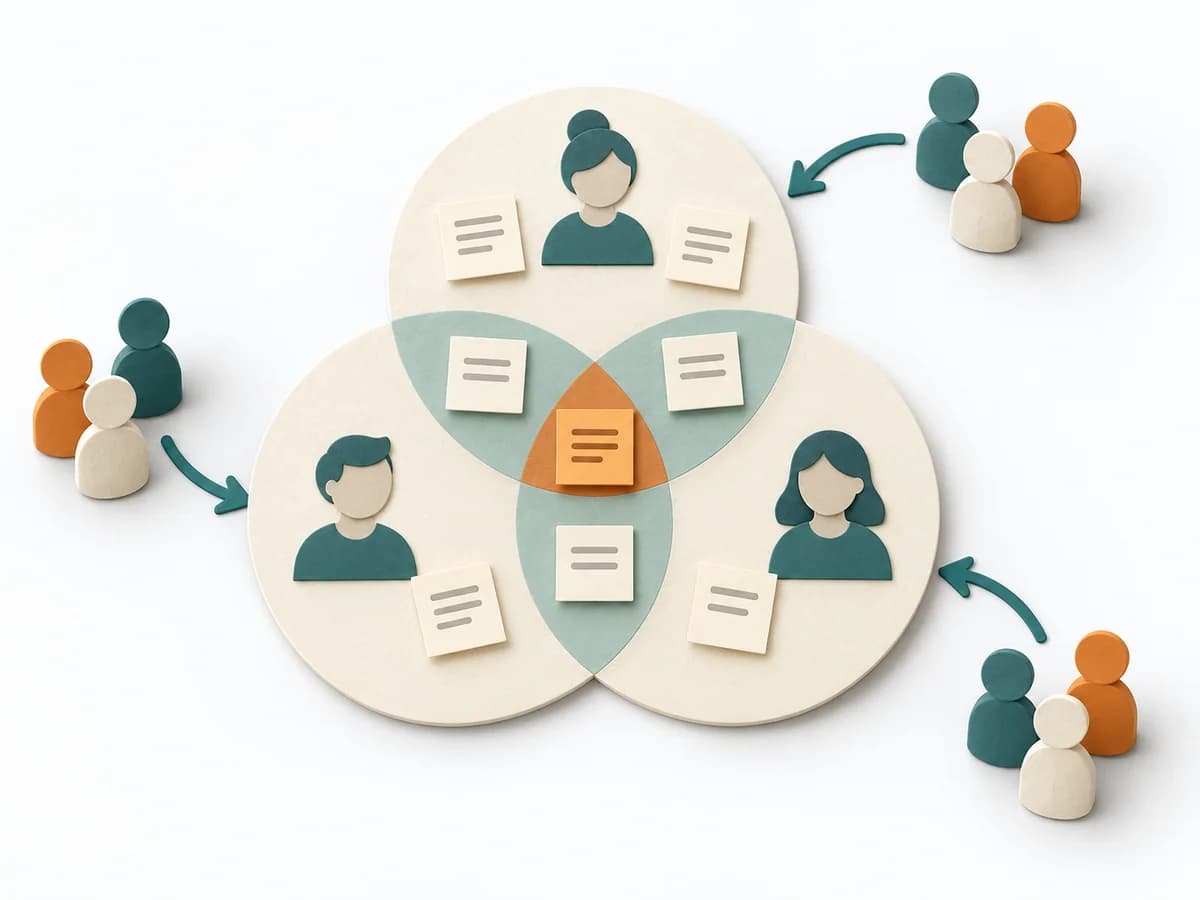 Facilitation 3-Circle Venn Diagram |
|---|---|---|---|---|
Purposedifferent | Event Modeling connects business workflows with commands, events, and views into one coherent mental model. It helps design behavior, UI, and technical slices from the same underlying logic. | When several people work toward one goal but hold different mental maps, Alignment Mapping makes the discrepancies visible. It arranges goals, assumptions, and priorities so shared direction becomes verifiable. | When a goal needs to be connected to several possible paths, it shows chains of impact instead of feature lists. It connects business goal, behavior change, and measures. | When three perspectives matter at the same time, a Three-Circle Venn Diagram shows the overlaps and remainders precisely. It makes visible where shared effect arises and where only a partial perspective applies. |
Complexitydifferent | Medium | Medium | Medium | Low |
Timedifferent | 2-6 h | 1-2 h | 45-90 min | 15-45 min |
Participantsdifferent | 2-8 | 4-12 | 3-8 | 2-8 |
Formatdifferent | Workshop + async | Workshop | Workshop | Workshop + async |
Outputdifferent | Event Model, UI Flow, Commands, Read Models | Alignment Map, Open Issues, Decision Questions | Impact Map, Outcome Hypotheses, Delivery Options | Venn Diagram, Overlap Notes, Differentiators |
Tagsno overlap | EventsBlueprintDomain-Driven DesignBehavior | AlignmentStakeholdersStrategyFacilitation | OutcomesStrategyBehaviorPlanning | ComparisonFacilitationAlignment |