View methods side by side.
Choose up to four methods. Add them using the search and share the comparison by copying its link.
| Criterion |  UX Research Empathy Mapping | 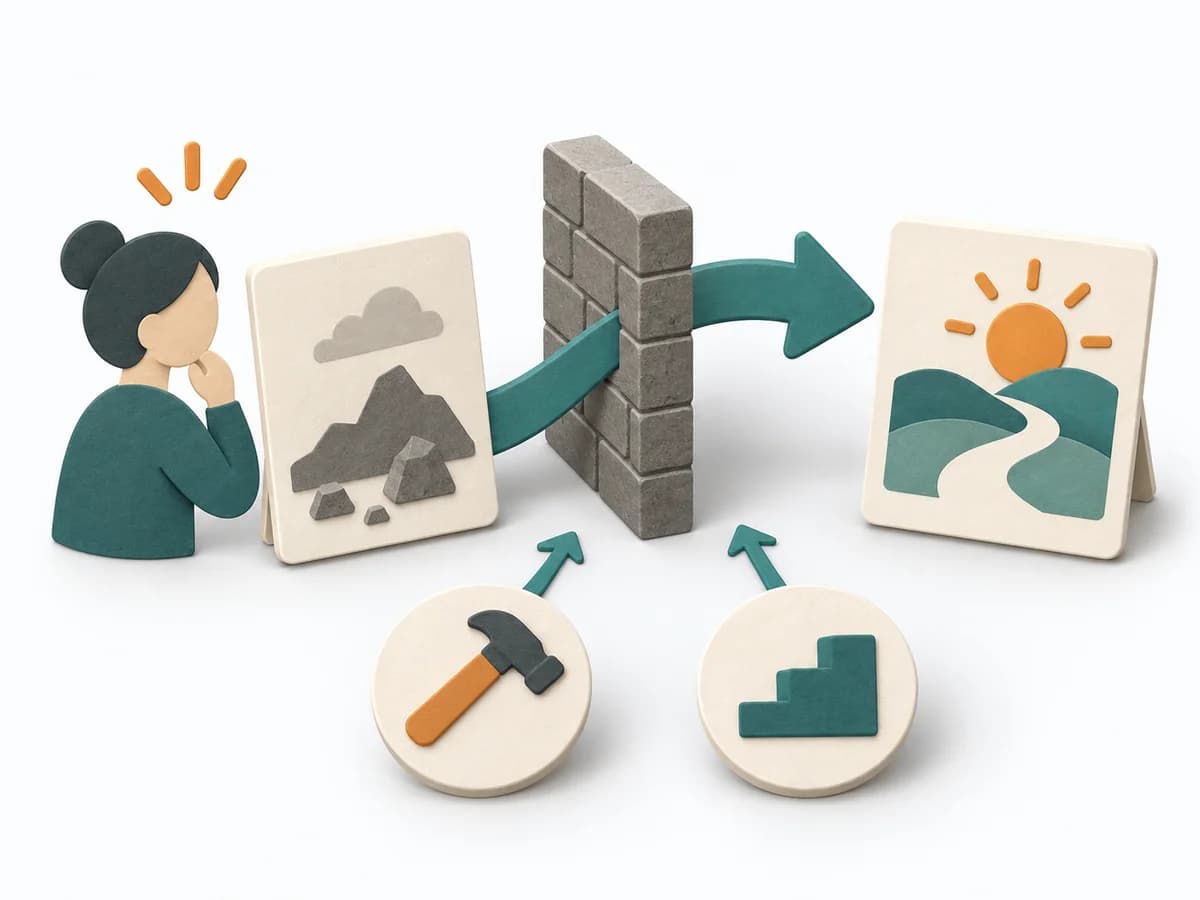 Product Discovery Jobs to Be Done | 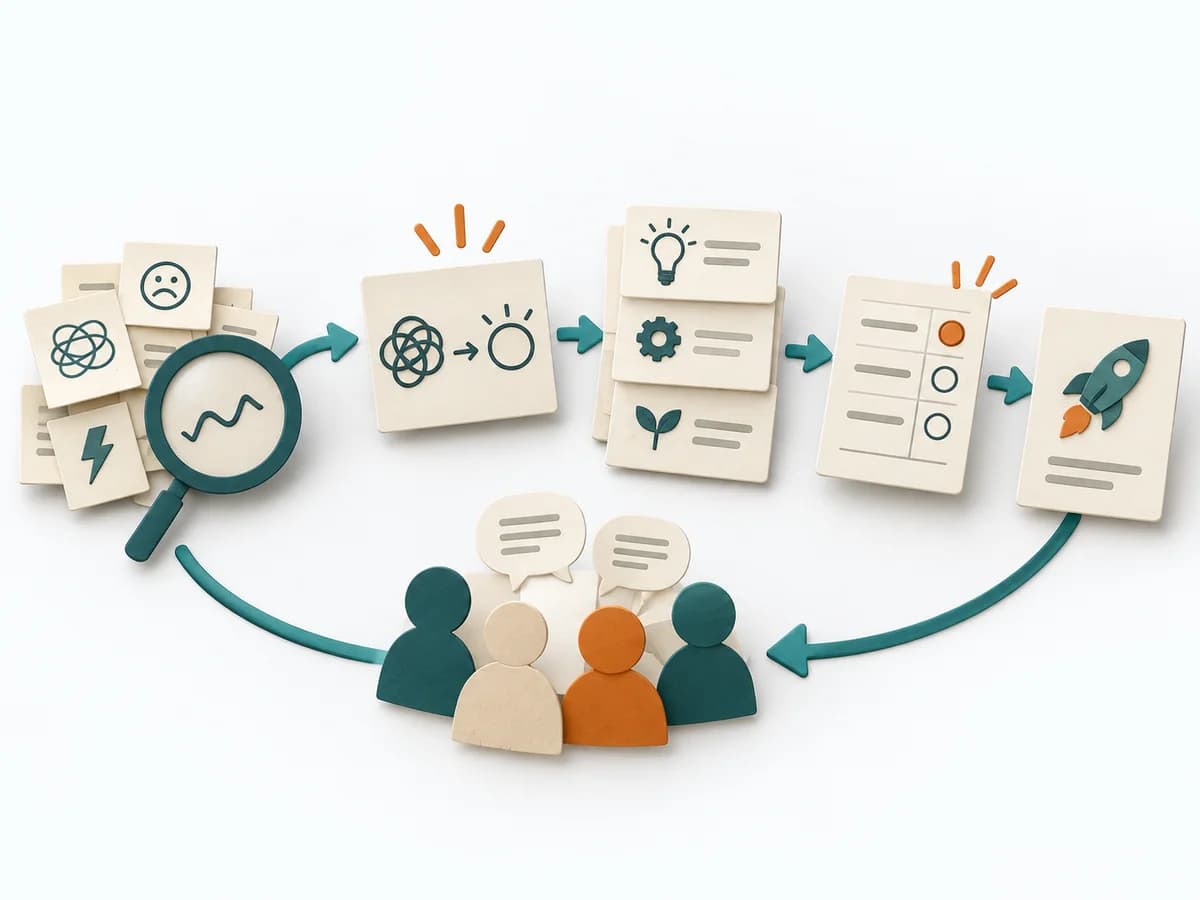 Facilitation Decision Jam |  UX Research Affinity Diagramming |
|---|---|---|---|---|
Purposedifferent | When a lot is assumed about a target group but little is seen jointly, empathy mapping makes knowledge and gaps directly comparable. The picture also shows which assumptions hold up and where evidence is missing. | When switching motives and progress are unclear, it reconstructs the situation from real customer circumstances. It shows why a switch happens and what kind of progress is being sought. | When a decision is stuck, Decision Jam loosens the knot through structured separation of problem, idea, and selection. The format creates movement without jumping prematurely at the first seemingly elegant answer. | When research notes, feedback, or observations sit unconnected side by side, affinity diagramming sorts the raw material into solid themes. Many individual points turn into patterns that make decisions and opportunities clearer. |
Complexitydifferent | Low | Medium | Low | Low |
Timedifferent | 30–60 min | 1-3 Wochen | 60-90 min | 45–90 min |
Participantsdifferent | 4-8 | 5-12 Interviews | 4-10 | 3-10 |
Formatdifferent | Workshop | Workshop + async | Workshop | Workshop |
Outputdifferent | Empathy Map, Assumptions List, Research Gaps | Job Stories, Outcome Statements, Opportunity List | Problem Cluster, Prioritized Challenge, Experiment | Theme clusters, Insight statements, Opportunity areas |
Tagsno overlap | SynthesisQualitativeWorkshop | CustomerOutcomesNeeds | FacilitationDecisionProblem solvingWorkshop | SynthesisQualitativeRoot cause |