View methods side by side.
Choose up to four methods. Add them using the search and share the comparison by copying its link.
| Criterion |  UX Research Empathy Mapping | 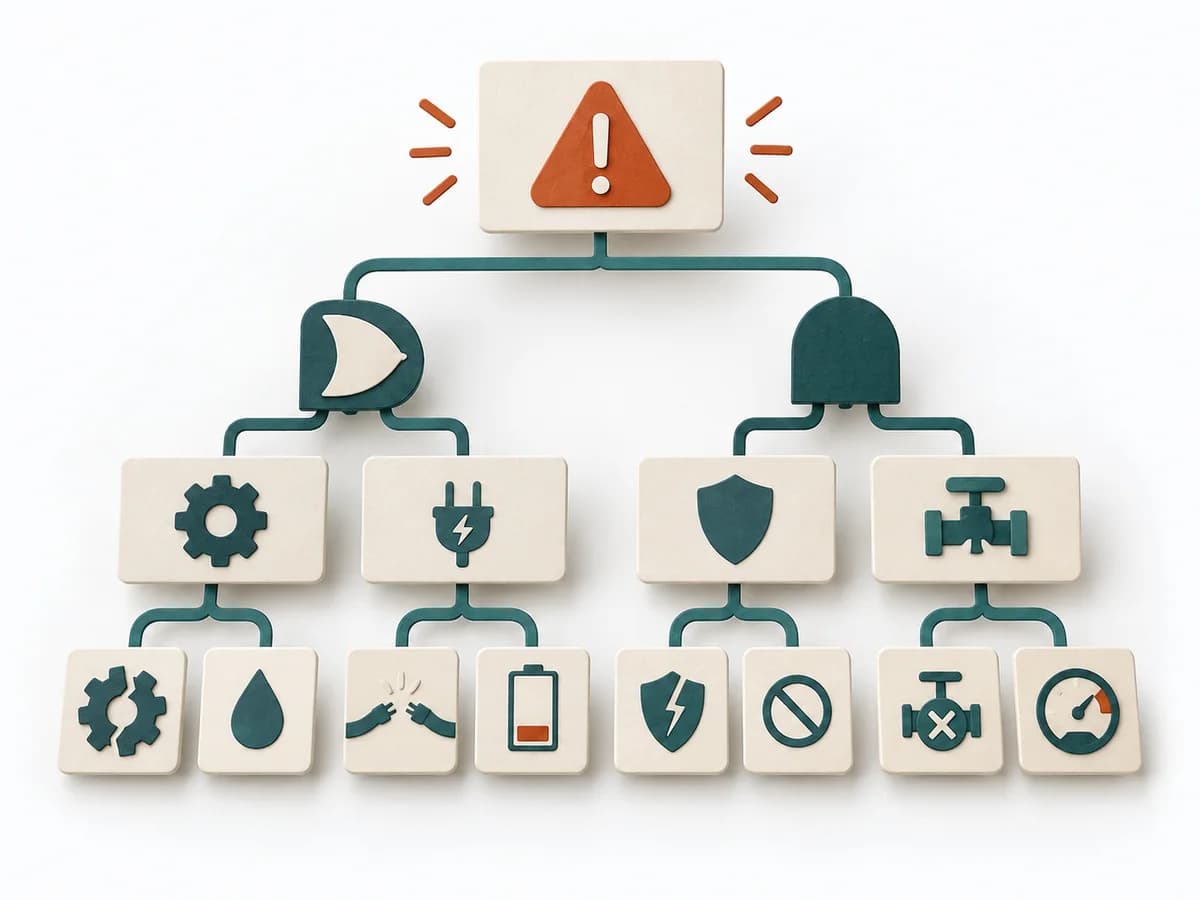 Operations Fault Tree Analysis |  UX Research Affinity Diagramming |  Architecture Risk Storming |
|---|---|---|---|---|
Purposedifferent | When a lot is assumed about a target group but little is seen jointly, empathy mapping makes knowledge and gaps directly comparable. The picture also shows which assumptions hold up and where evidence is missing. | For a critical top event with several possible triggers, the method logically models failure paths. It makes visible which combinations of conditions can lead to damage. | When research notes, feedback, or observations sit unconnected side by side, affinity diagramming sorts the raw material into solid themes. Many individual points turn into patterns that make decisions and opportunities clearer. | Helps clarify architecture context, options, and consequences in concrete terms. It organizes technical context, alternatives, and consequences. The result is captured as an Annotated Diagram, a Prioritized Risk List, and an Action Backlog. |
Complexitydifferent | Low | High | Low | Low |
Timedifferent | 30–60 min | 2-6 h | 45–90 min | 60-90 min |
Participantsdifferent | 4-8 | 3-8 | 3-10 | 4-12 |
Formatdifferent | Workshop | Workshop + async | Workshop | Workshop |
Outputdifferent | Empathy Map, Assumptions List, Research Gaps | Fault Tree, Critical Paths, Cause Hypotheses, Control Actions | Theme clusters, Insight statements, Opportunity areas | Annotated Diagram, Prioritized Risk List, Action Backlog |
Tagsno overlap | SynthesisQualitativeWorkshop | RiskRoot causeSafety | SynthesisQualitativeRoot cause | RiskArchitectureWorkshopValidation |