View methods side by side.
Choose up to four methods. Add them using the search and share the comparison by copying its link.
| Criterion | 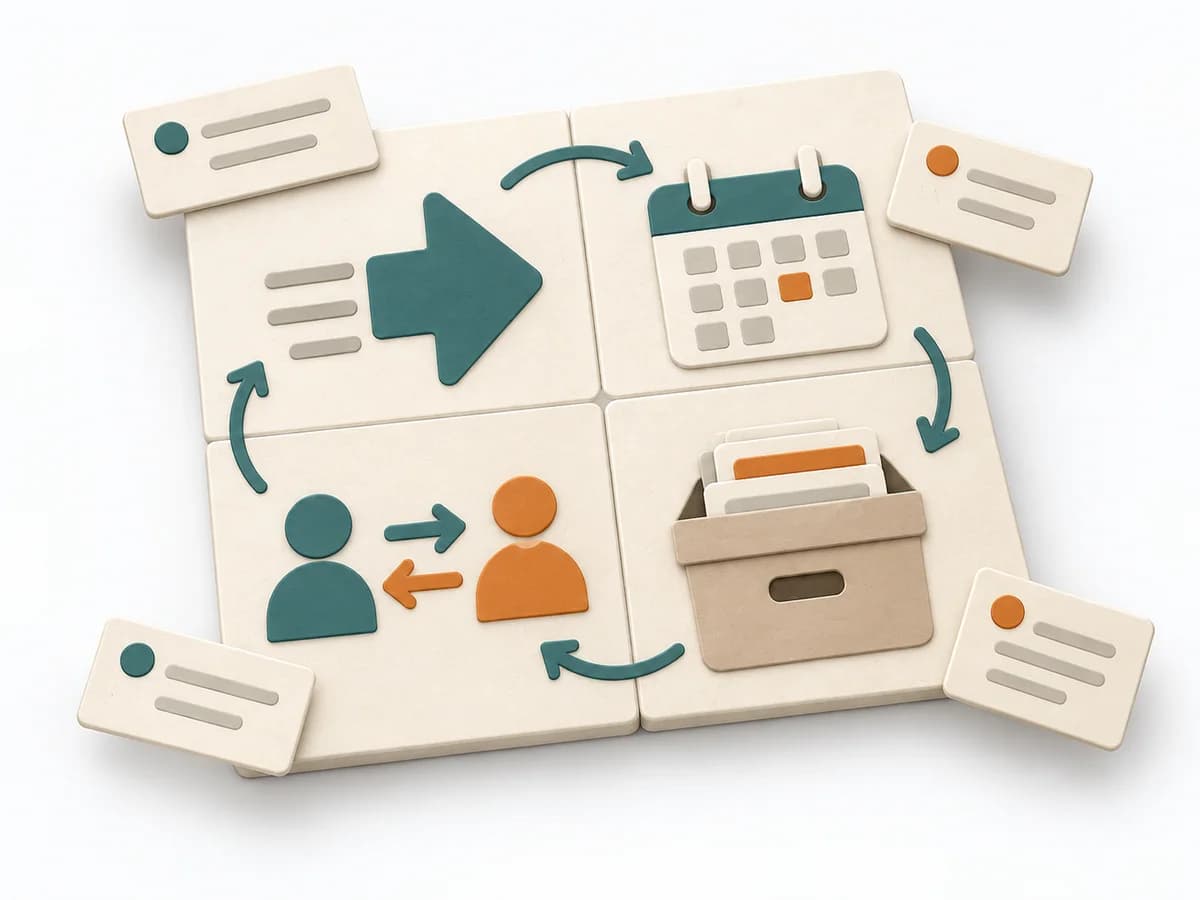 Decision Making Eisenhower Matrix |  UX Research User Interviews |  UX Research Affinity Diagramming | 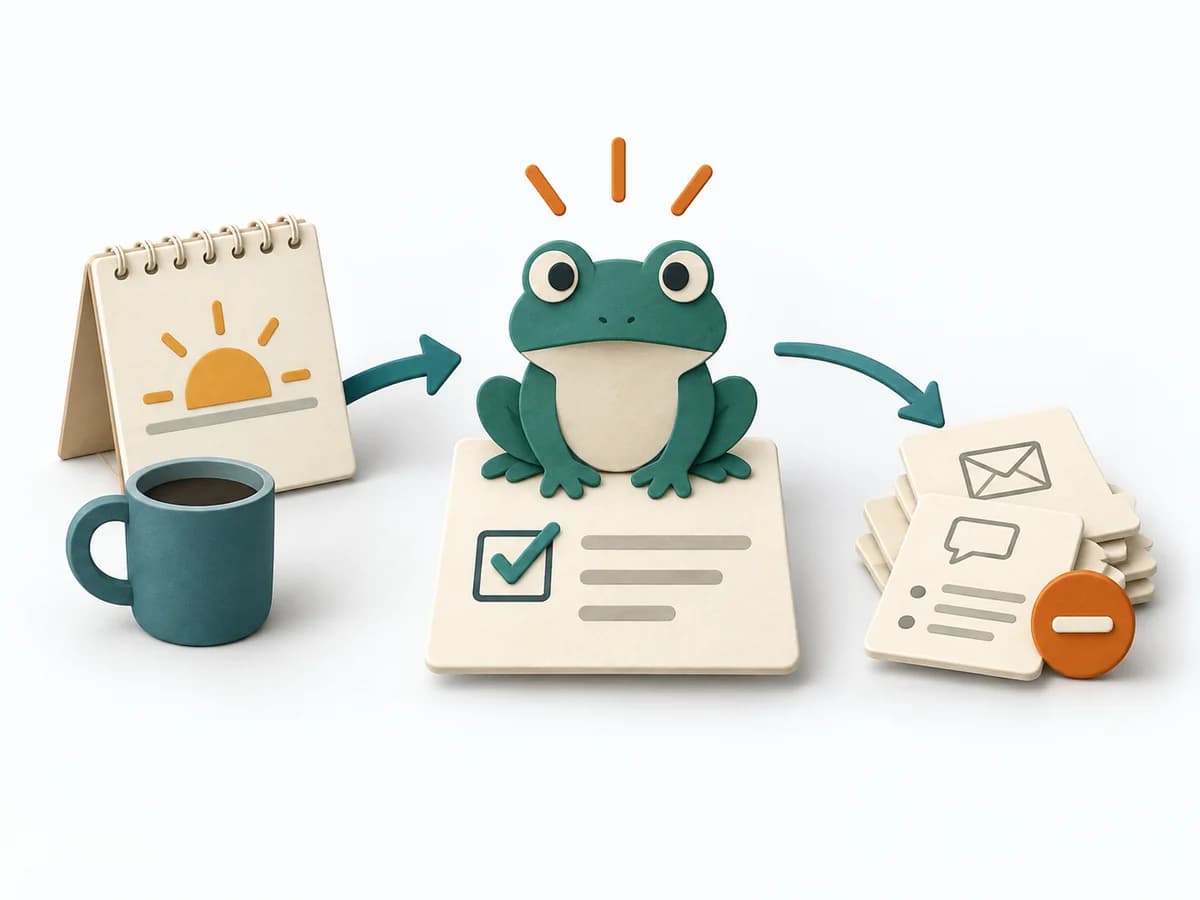 Operations Eat the Frog |
|---|---|---|---|---|
Purposedifferent | It separates true priorities from noise so it becomes clear what should be done now, scheduled, delegated, or dropped. | When teams derive needs only from assumptions and real motives are missing, user interviews give direct access to behavior and meaning. Conversations from the target group's everyday life make patterns, tensions, and open questions solidly visible. | When research notes, feedback, or observations sit unconnected side by side, affinity diagramming sorts the raw material into solid themes. Many individual points turn into patterns that make decisions and opportunities clearer. | The method protects energy and attention for the task that creates the largest progress and is often postponed. |
Complexitysame | Low | Low | Low | Low |
Timedifferent | 15-30 min | 30–60 min per interview | 45–90 min | 15-90 min daily |
Participantsdifferent | 1-6 | 1 participant per interview | 3-10 | 1 |
Formatdifferent | Workshop + async | Workshop + async | Workshop | Async |
Outputdifferent | Eisenhower Matrix, Action List, Delegation Notes | Interview Notes, Themes, Insight Summary | Theme clusters, Insight statements, Opportunity areas | Priority Task, Completion Note, Daily Focus |
Tagsno overlap | PrioritizationFocusTasks | QualitativeResearchCustomerDiscovery | SynthesisQualitativeRoot cause | PrioritizationProductivityFocusExecution |