View methods side by side.
Choose up to four methods. Add them using the search and share the comparison by copying its link.
| Criterion |  Facilitation Dot Estimation | 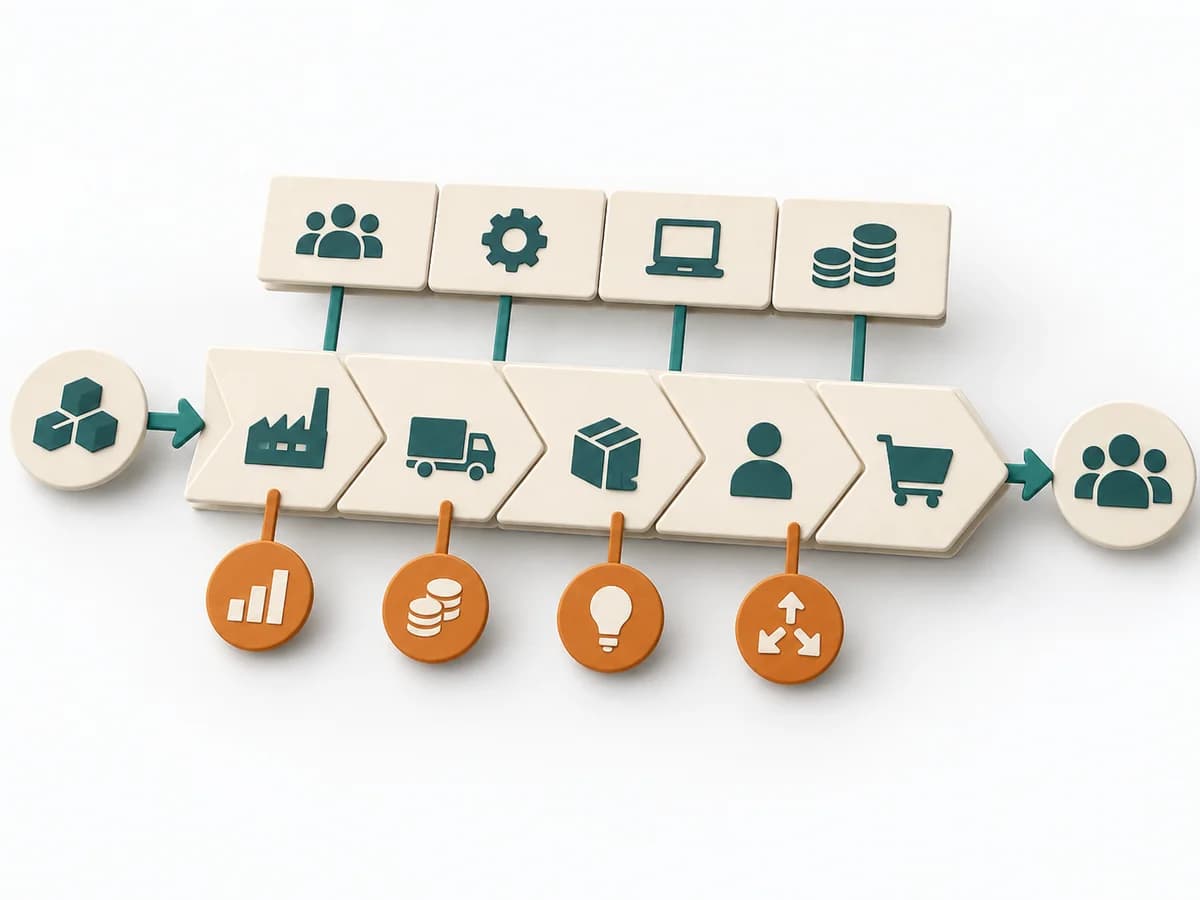 Business Strategy Value Chain Analysis |  Product Discovery Test Card | 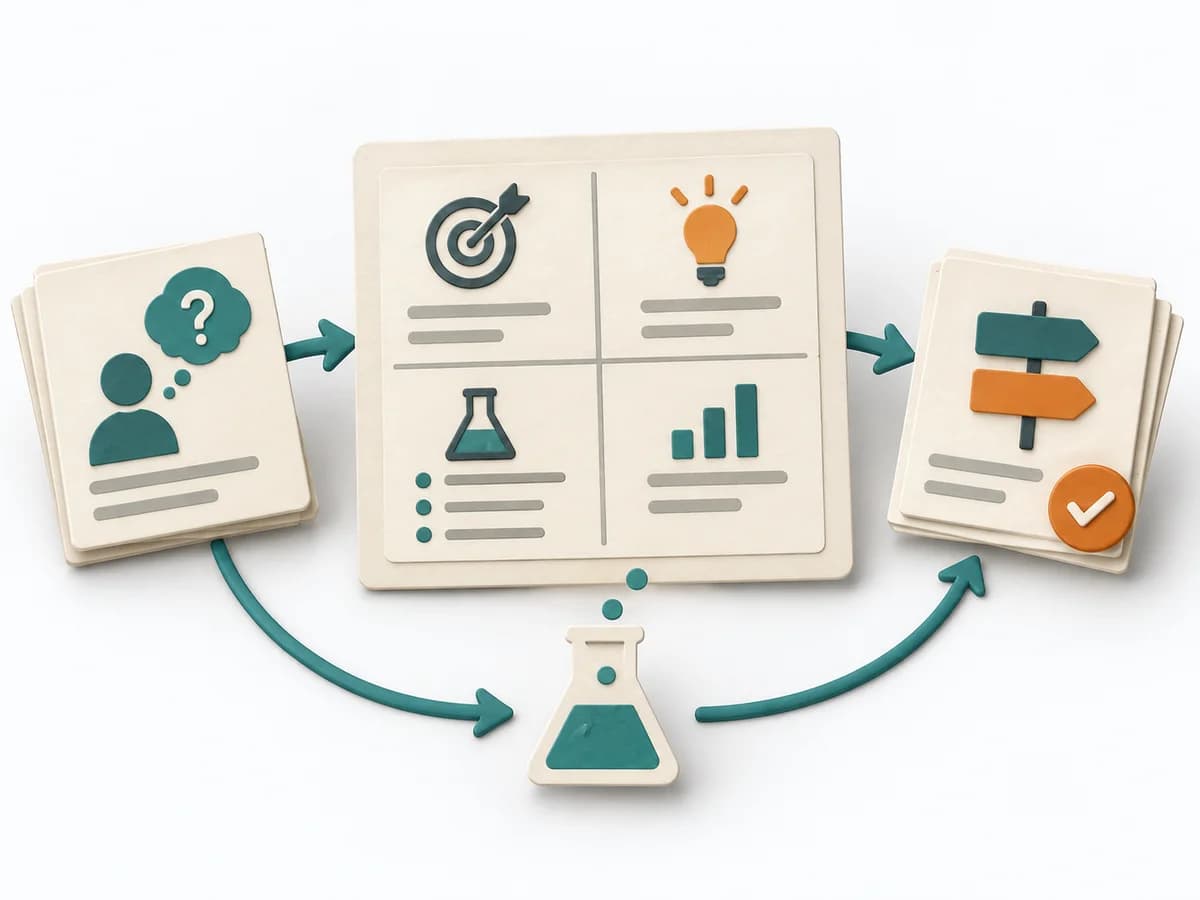 Product Discovery Experiment Canvas |
|---|---|---|---|---|
Purposedifferent | When size or effort can only be estimated roughly, Dot Estimation condenses the group's experience into a quick range. It turns individual contributions into a visible selection. The result is captured as an Effort Heatmap, Risk Signals, and Discussion Targets. | Value Chain Analysis shows where value is created, costs accrue, and differentiation becomes possible along the process. It compares strengths, risks, market logic, and courses of action. The result is captured as a value-chain map and lever list. | The Test Card turns a critical assumption into a testable claim and specifies in advance which result counts as success. | When experiments become unreadable after the fact, it arranges hypothesis, signal, and learning goal on a single canvas. It separates problem, assumption, solution, and evidence. The result is captured as a Completed Experiment Canvas and a Success Metric. |
Complexitydifferent | Low | High | Low | Low |
Timedifferent | 5-20 min | Half day | 20-35 min | 30-60 min |
Participantsdifferent | 3-20 | 3-8 | 1-5 | 1-5 |
Formatdifferent | Workshop | Workshop | Workshop + async | Workshop + async |
Outputdifferent | Effort Heatmap, Risk Signals, Discussion Targets | Value Chain Map, Lever List | Test Card with a pre-set threshold | Completed Experiment Canvas, Success Metric |
Tagsno overlap | EstimationEffortRisk | StrategyBusiness modelDiagnosisAnalysis | ExperimentsValidationDiscoveryHypothesis | ExperimentsValidationDiscoveryHypothesis |