View methods side by side.
Choose up to four methods. Add them using the search and share the comparison by copying its link.
| Criterion |  Facilitation Dot Estimation | 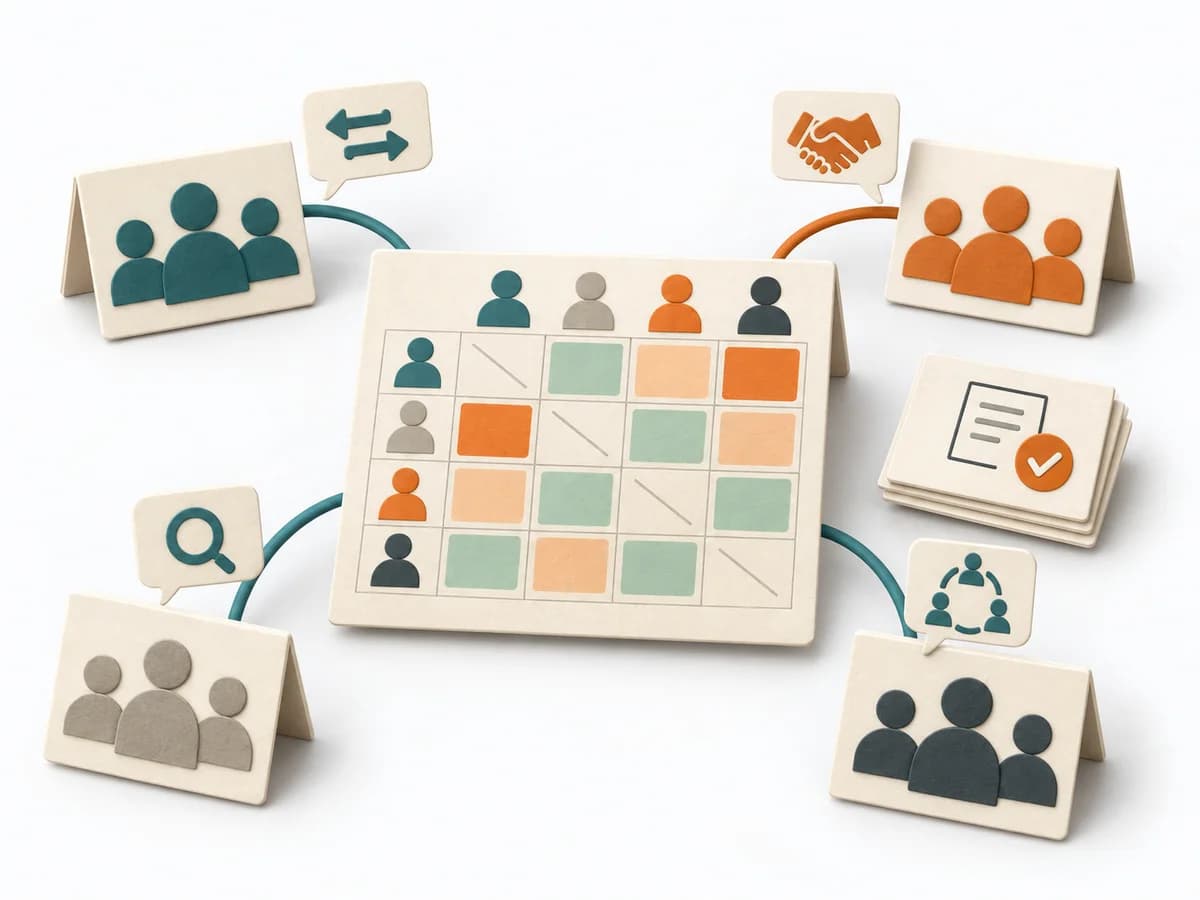 Team Design Team Topologies Interaction Modes | 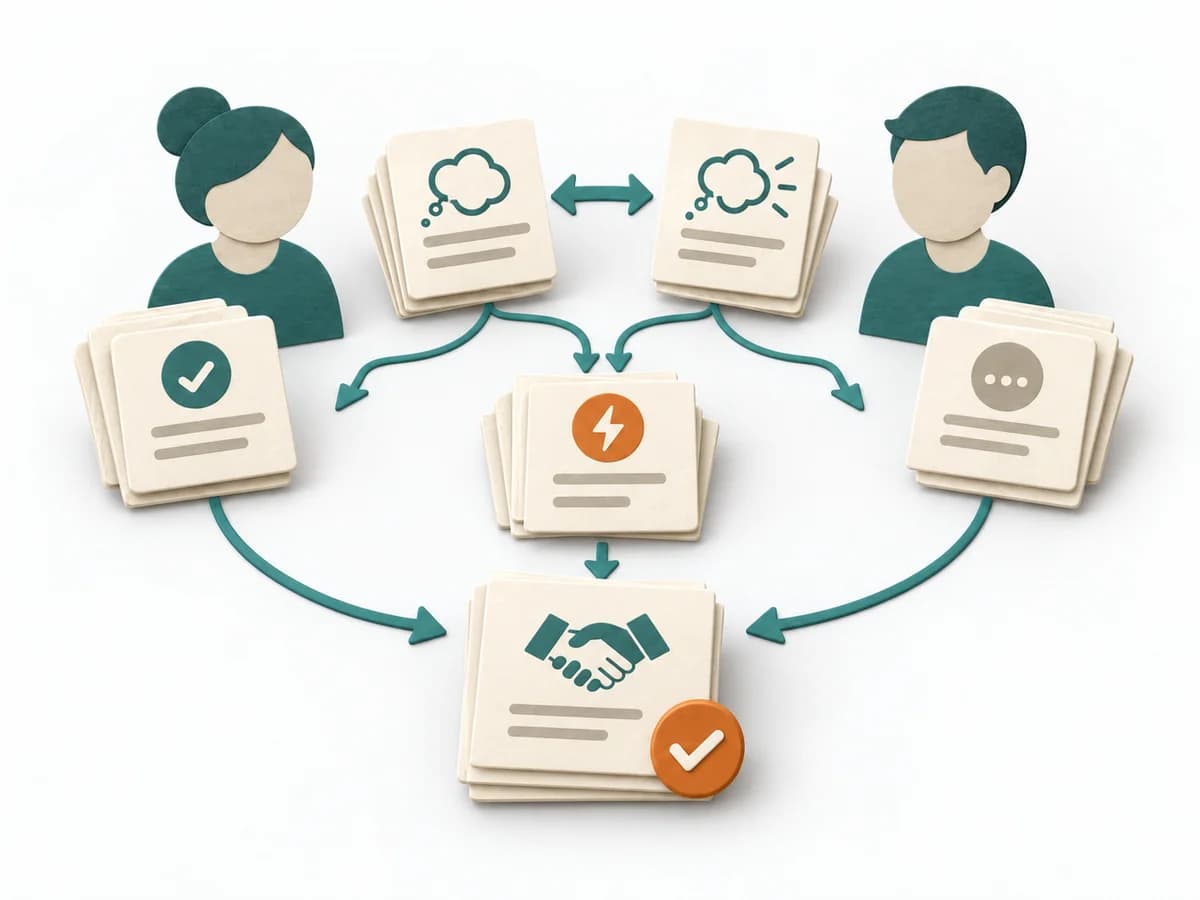 Facilitation Expectation Mapping | 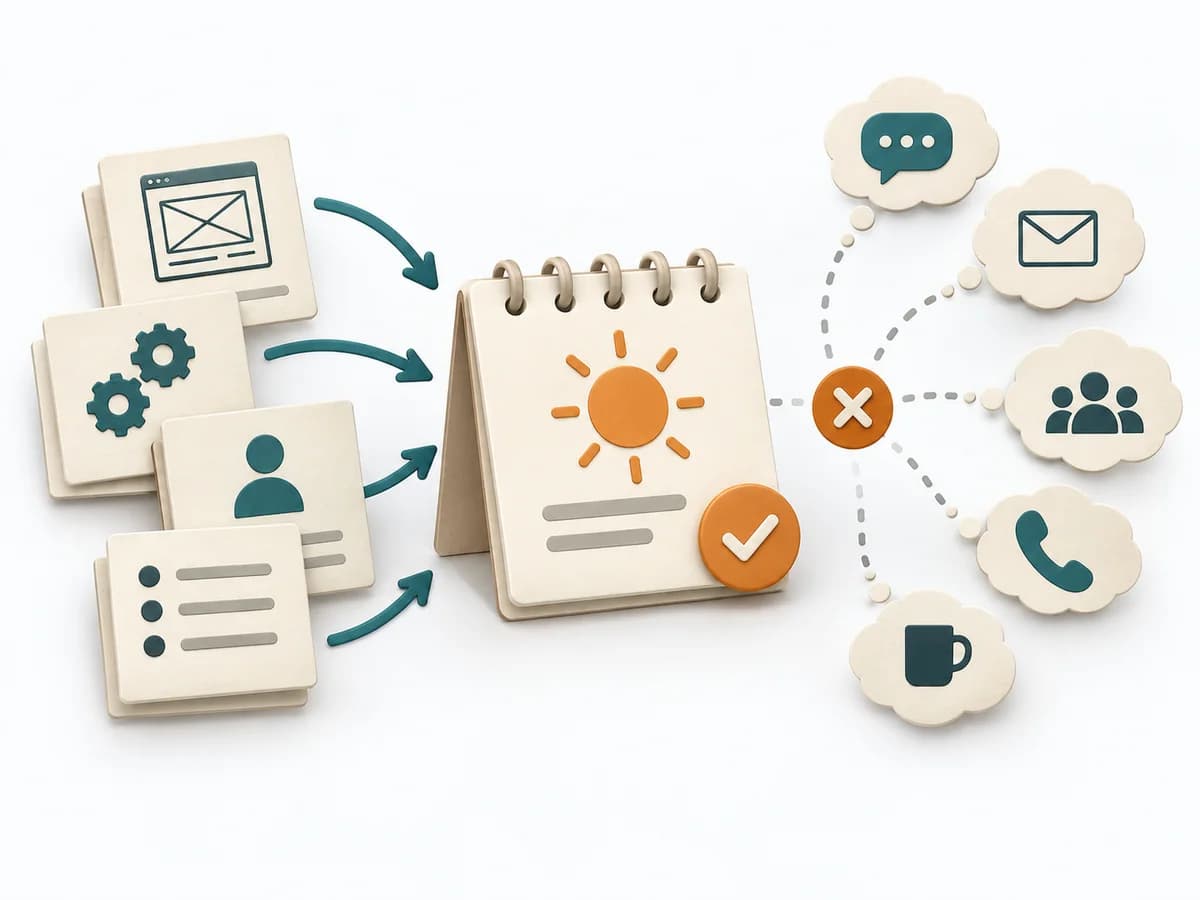 Agile Ideal Days |
|---|---|---|---|---|
Purposedifferent | When size or effort can only be estimated roughly, Dot Estimation condenses the group's experience into a quick range. It turns individual contributions into a visible selection. The result is captured as an Effort Heatmap, Risk Signals, and Discussion Targets. | When several teams collaborate repeatedly, it describes the right interaction mode for each interface between them. It clarifies responsibility, interaction, and load between teams. The result is captured as an interaction heat map and pairwise agreements. | When roles, interfaces, or projects fail because of differing expectations, Expectation Mapping surfaces these differences. It shows what each side takes for granted and where the pictures diverge. | When effort needs to be thought of as real working time, it offers a simple common denominator for comparison. It sorts work by value, risk, and delivery ability. The result is captured as Ideal Day Estimates, Assumption Notes, and Capacity Caveats. |
Complexitydifferent | Low | Medium | Low | Low |
Timedifferent | 5-20 min | Half day | 45-90 min | 15-60 min |
Participantsdifferent | 3-20 | Team-Leads plus Architecture | 3-12 | 2-9 |
Formatdifferent | Workshop | Workshop | Workshop | Workshop + async |
Outputdifferent | Effort Heatmap, Risk Signals, Discussion Targets | Interaction Heat Map, Agreements per Pair | Expectation Map, Alignment Notes, Agreements | Ideal Day Estimates, Assumption Notes, Capacity Caveats |
Tagsno overlap | EstimationEffortRisk | TeamAlignmentCollaborationOrganization | AlignmentStakeholdersTeam | EstimationEffortAgile |