View methods side by side.
Choose up to four methods. Add them using the search and share the comparison by copying its link.
| Criterion |  Facilitation Dot Estimation |  Product Strategy OKRs |
|---|---|---|
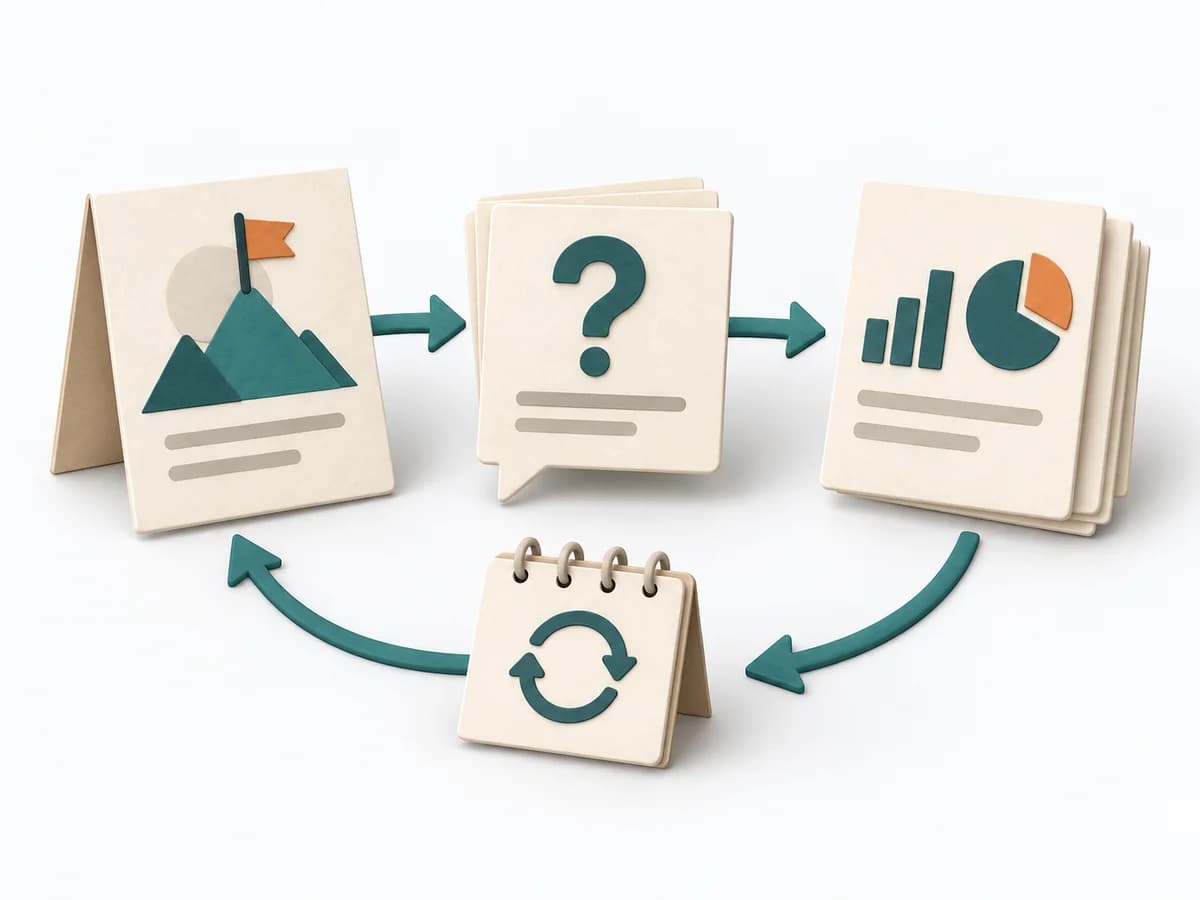
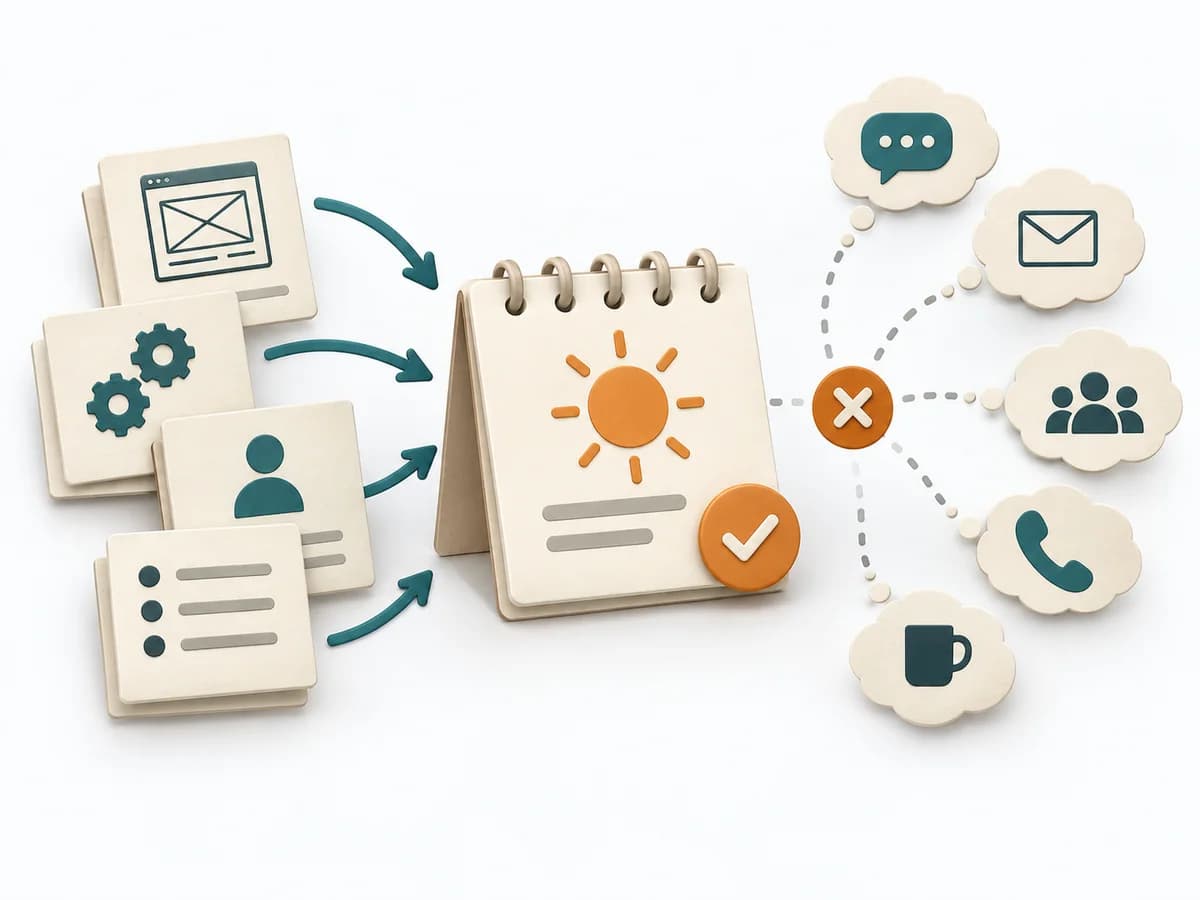
Purposedifferent | When size or effort can only be estimated roughly, Dot Estimation condenses the group's experience into a quick range. It turns individual contributions into a visible selection. The result is captured as an Effort Heatmap, Risk Signals, and Discussion Targets. | When strategic direction needs to become measurable, it connects ambition with checkable results. It makes goals connectable to focus and review. |
Complexitydifferent | Low | Medium |
Timedifferent | 5-20 min | 1-2 h Setup |
Participantsdifferent | 3-20 | 2-20 |
Formatdifferent | Workshop | Workshop + async |
Outputdifferent | Effort Heatmap, Risk Signals, Discussion Targets | OKR set, Measurement plan, Review cadence |
Tagsno overlap | EstimationEffortRisk | GoalsAlignmentOutcomesMeasurement |
Often compared together
Methods with strong topical overlap with the current selection, not yet in the comparison.