View methods side by side.
Choose up to four methods. Add them using the search and share the comparison by copying its link.
| Criterion |  Facilitation Dot Estimation |  Business Strategy GAP Analysis | 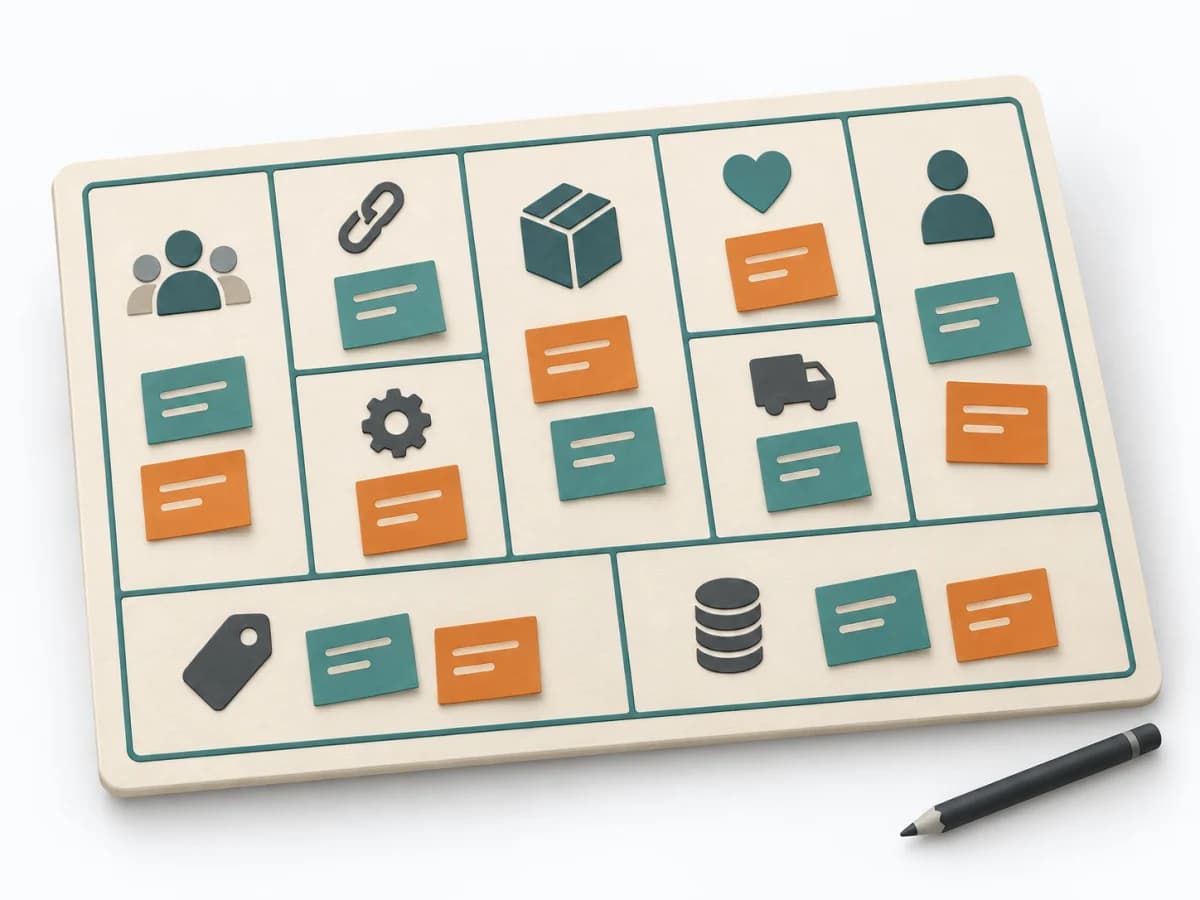 Business Strategy Business Model Canvas | 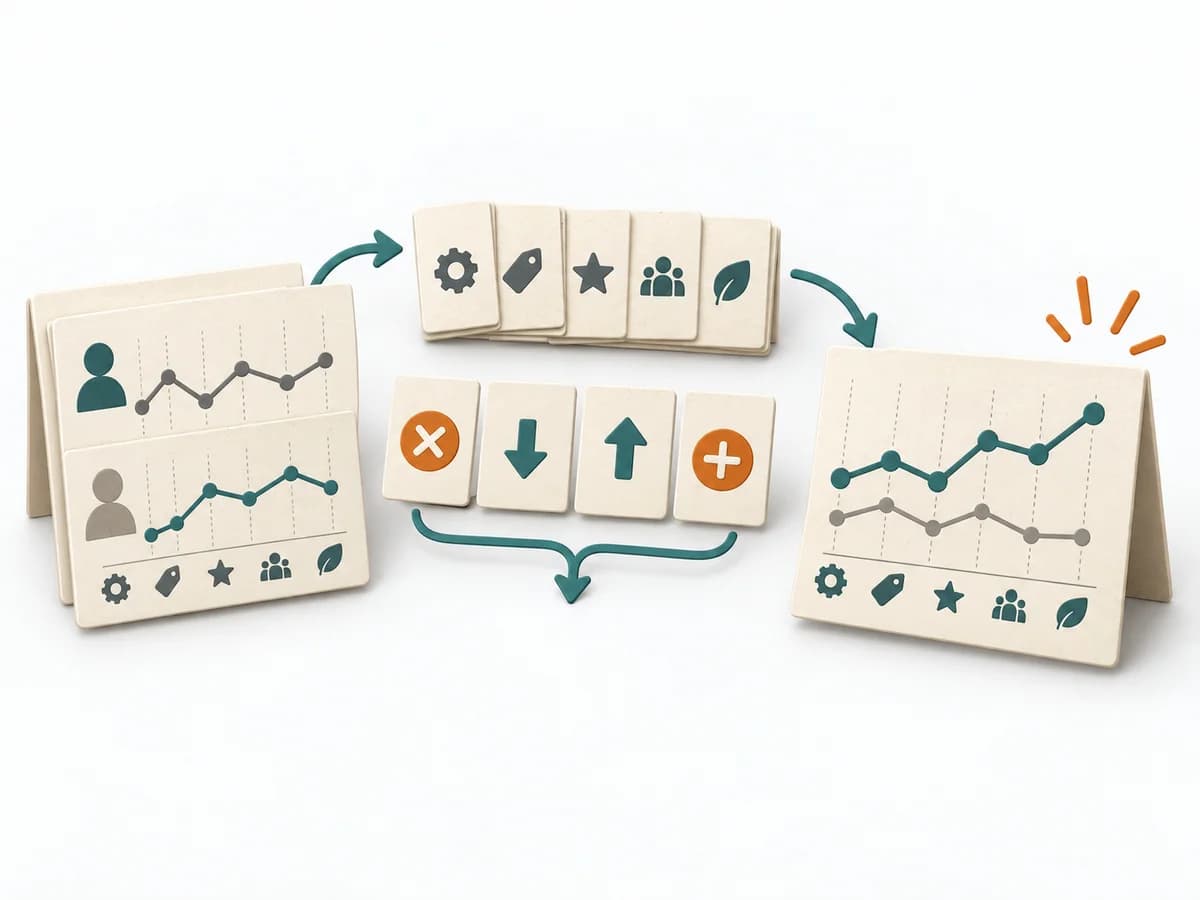 Business Strategy Blue Ocean Strategy Canvas |
|---|---|---|---|---|
Purposedifferent | When size or effort can only be estimated roughly, Dot Estimation condenses the group's experience into a quick range. It turns individual contributions into a visible selection. The result is captured as an Effort Heatmap, Risk Signals, and Discussion Targets. | GAP Analysis compares the current state with a target picture and makes the distance manageable. It becomes useful when, ahead of new initiatives, it must become clear which capabilities, processes, or resources are missing. | The Business Model Canvas condenses a business model to its key building blocks and assumptions. It makes variants quickly comparable and reveals gaps before validation or implementation begins. | The Blue Ocean Strategy Canvas shows how an offering is positioned relative to the market. Differentiation thereby becomes tangible in value factors instead of merely being claimed. |
Complexitydifferent | Low | Medium | Medium | Medium |
Timedifferent | 5-20 min | 1-3 h | 1-2 h | 2-4 h |
Participantsdifferent | 3-20 | 2-8 | 2-8 | 3-10 |
Formatdifferent | Workshop | Workshop + async | Workshop + async | Workshop |
Outputdifferent | Effort Heatmap, Risk Signals, Discussion Targets | Gap Matrix, Action Plan, Risk Notes | Business Model Canvas, Assumption List, Business Hypotheses | Strategy Canvas, Value Curve, ERRC Actions |
Tagsno overlap | EstimationEffortRisk | StrategyAnalysisPlanning | Business modelStrategyValueInnovation | StrategyPositioningInnovationValue |