View methods side by side.
Choose up to four methods. Add them using the search and share the comparison by copying its link.
| Criterion |  Facilitation Dot Estimation | 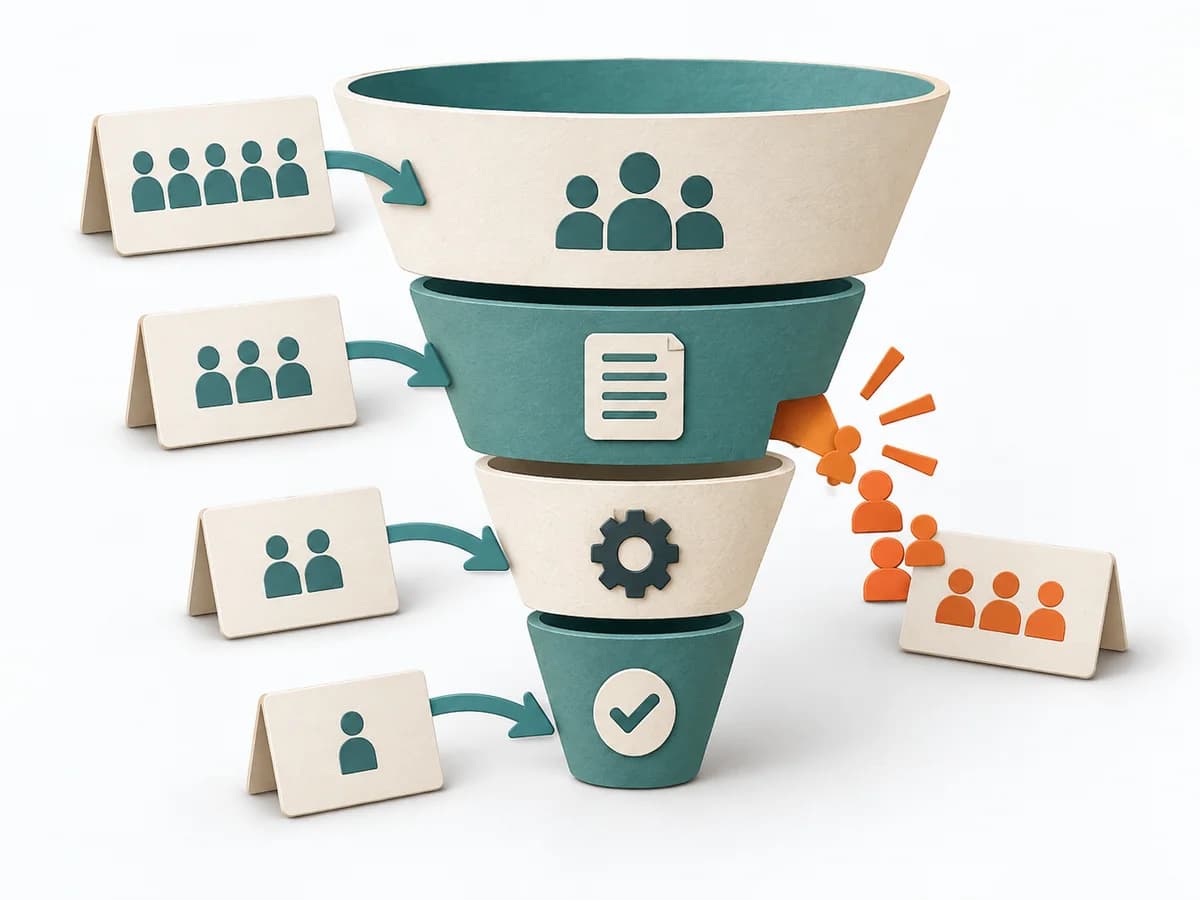 Growth Funnel Analysis | 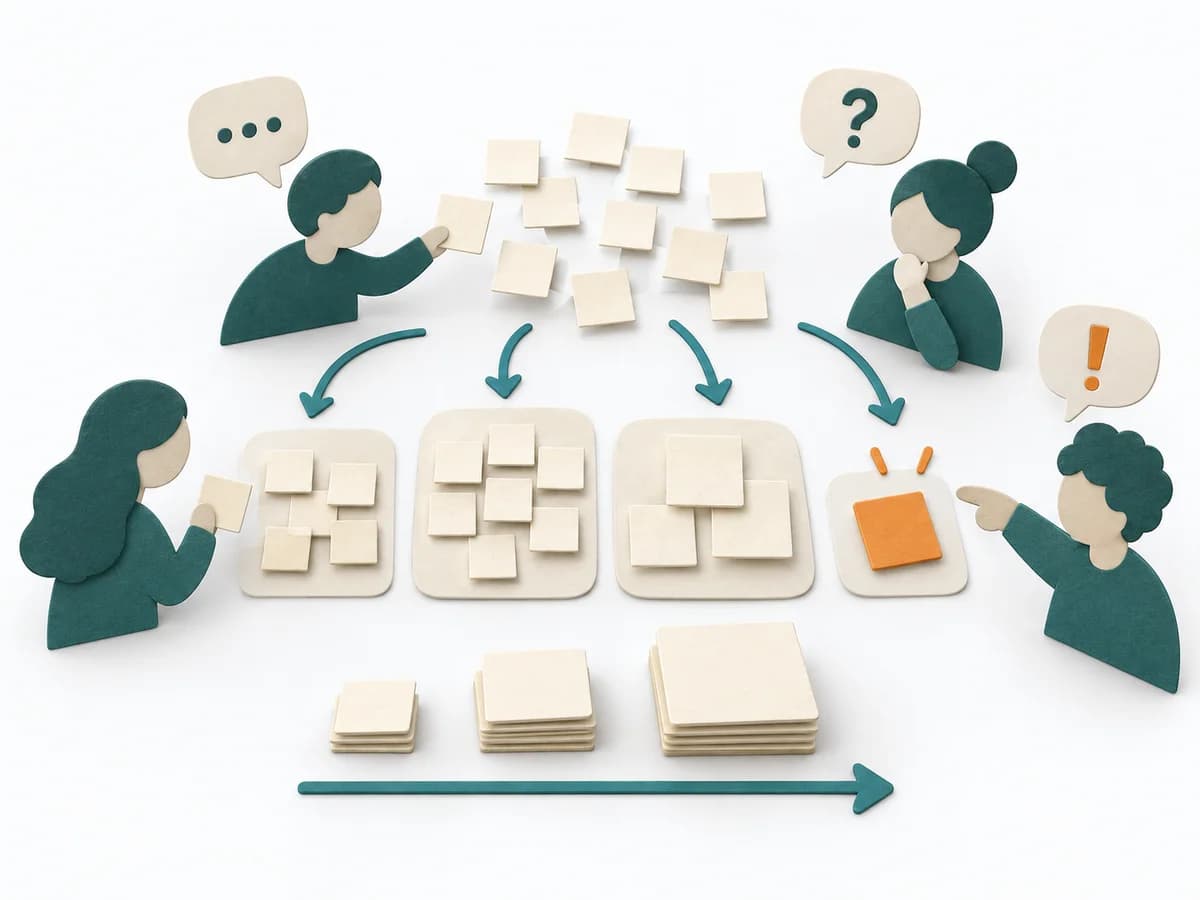 Agile Affinity Estimation |  Growth A/B Testing |
|---|---|---|---|---|
Purposedifferent | When size or effort can only be estimated roughly, Dot Estimation condenses the group's experience into a quick range. It turns individual contributions into a visible selection. The result is captured as an Effort Heatmap, Risk Signals, and Discussion Targets. | When many visitors or users drop off along the way, the reason behind the number often stays hidden. Funnel Analysis exposes these transitions and makes visible exactly where the path collapses. | When many tasks need to be classified quickly, it sorts them by perceived effort and similarity. It reduces the effort of fine-grained estimation for large volumes. | When two variants compete, discussions quickly decide by taste rather than effect. A/B Testing checks behavior under controlled conditions and separates real improvement from chance or expectation effects. |
Complexitydifferent | Low | Medium | Medium | High |
Timedifferent | 5-20 min | 1-3 h | 30-90 min | 1-4 Wochen |
Participantsdifferent | 3-20 | 1-5 | 3-12 | 1-6 |
Formatdifferent | Workshop | Async | Workshop | Async |
Outputdifferent | Effort Heatmap, Risk Signals, Discussion Targets | Funnel report, Drop-off analysis, Optimization hypotheses | Affinity Size Map, Grouped Estimates, Unclear Items | Experiment results, Decision log, Learning summary |
Tagsno overlap | EstimationEffortRisk | AnalyticsConversionGrowth | EstimationBacklogRelative sizing | ExperimentsGrowthAnalyticsValidation |