View methods side by side.
Choose up to four methods. Add them using the search and share the comparison by copying its link.
| Criterion |  Facilitation Dot Estimation |  Operations Family Tree Analysis | 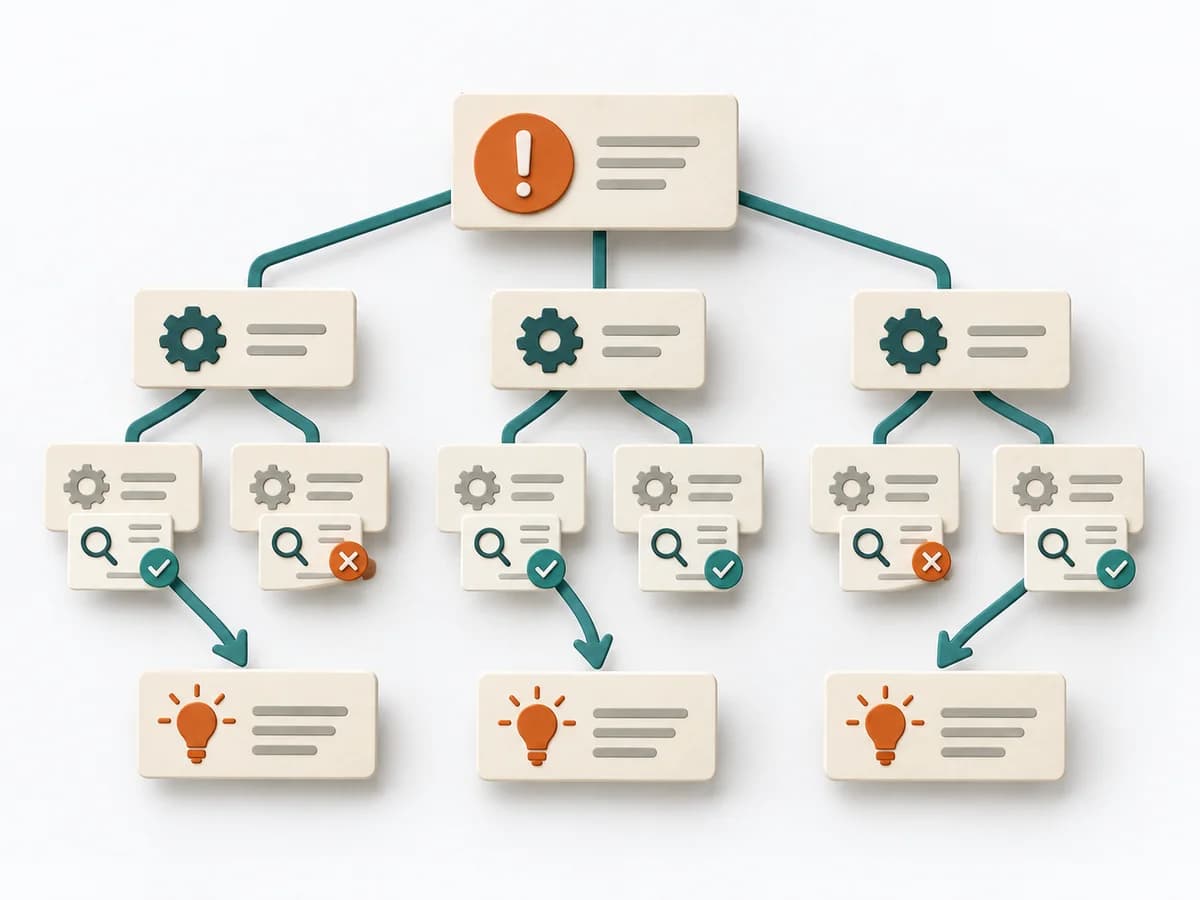 Operations Root Cause Tree Analysis | 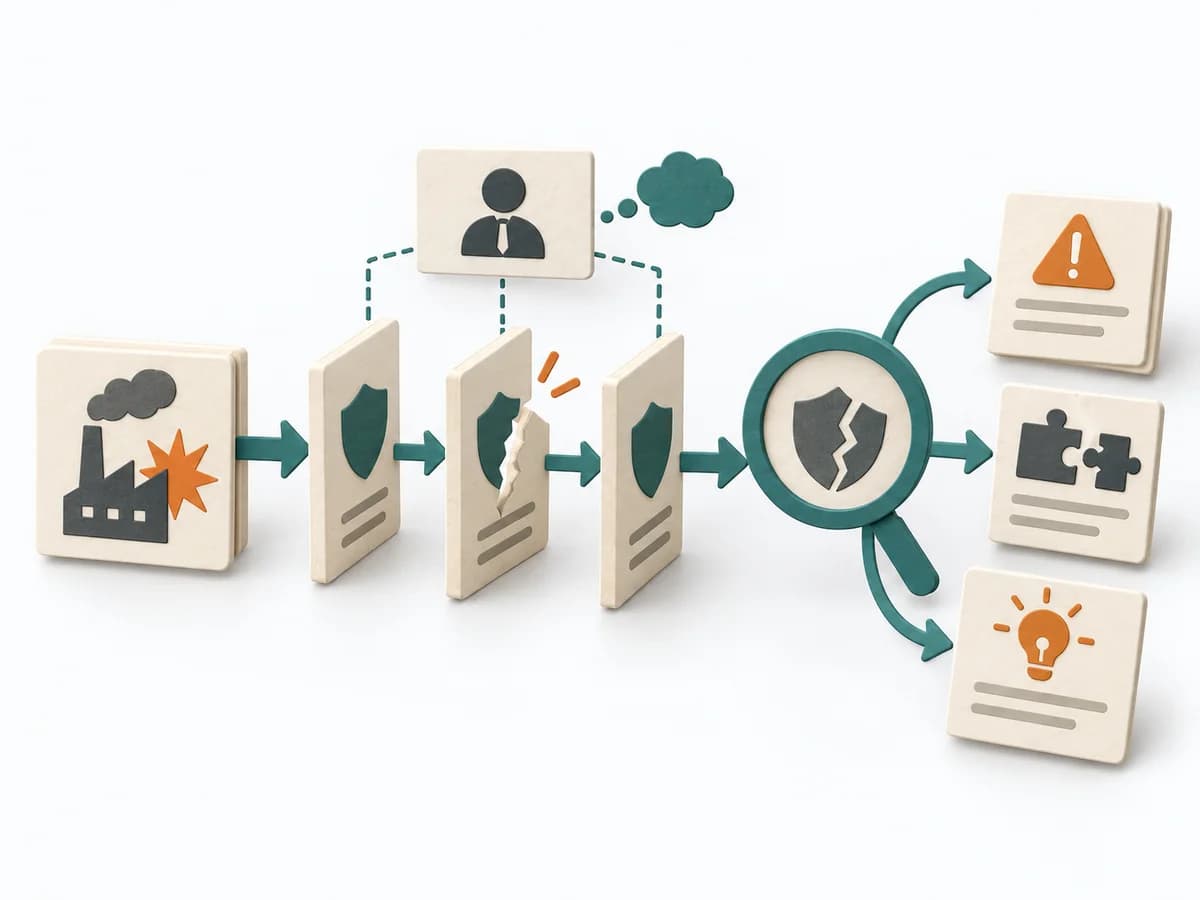 Operations MORT Analysis |
|---|---|---|---|---|
Purposedifferent | When size or effort can only be estimated roughly, Dot Estimation condenses the group's experience into a quick range. It turns individual contributions into a visible selection. The result is captured as an Effort Heatmap, Risk Signals, and Discussion Targets. | For a series of incidents with a similar pattern, the method arranges individual events as branches of a common origin. It makes visible which conditions keep recurring. | For a problem with several suspected causes, the method builds a causal structure instead of a mere list. It makes visible how causes connect and where the strongest points of leverage lie. | For a safety-relevant event or a system with high protection requirements, the method examines where controls failed. It exposes both technical and organizational gaps. |
Complexitydifferent | Low | Medium | Medium | High |
Timedifferent | 5-20 min | 2-4 h | 1-3 h | Mehrere Tage bis Wochen |
Participantsdifferent | 3-20 | 2-6 | 2-8 | 2-6 |
Formatdifferent | Workshop | Workshop + async | Workshop | Workshop + async |
Outputdifferent | Effort Heatmap, Risk Signals, Discussion Targets | Family Tree Diagram, Pattern Notes, Systemic Measures | Cause Tree, Evidence Notes, Countermeasures | MORT Worksheets, Findings per Branch, Corrective Actions, Systemic Recommendations |
Tagsno overlap | EstimationEffortRisk | Root causePatternsIncidentSystemic | Root causeTreeIncidentQuality | Root causeSafetySystemicIncident |