View methods side by side.
Choose up to four methods. Add them using the search and share the comparison by copying its link.
| Criterion |  Facilitation Dot Estimation |  Domain Modeling Bounded Context Canvas | 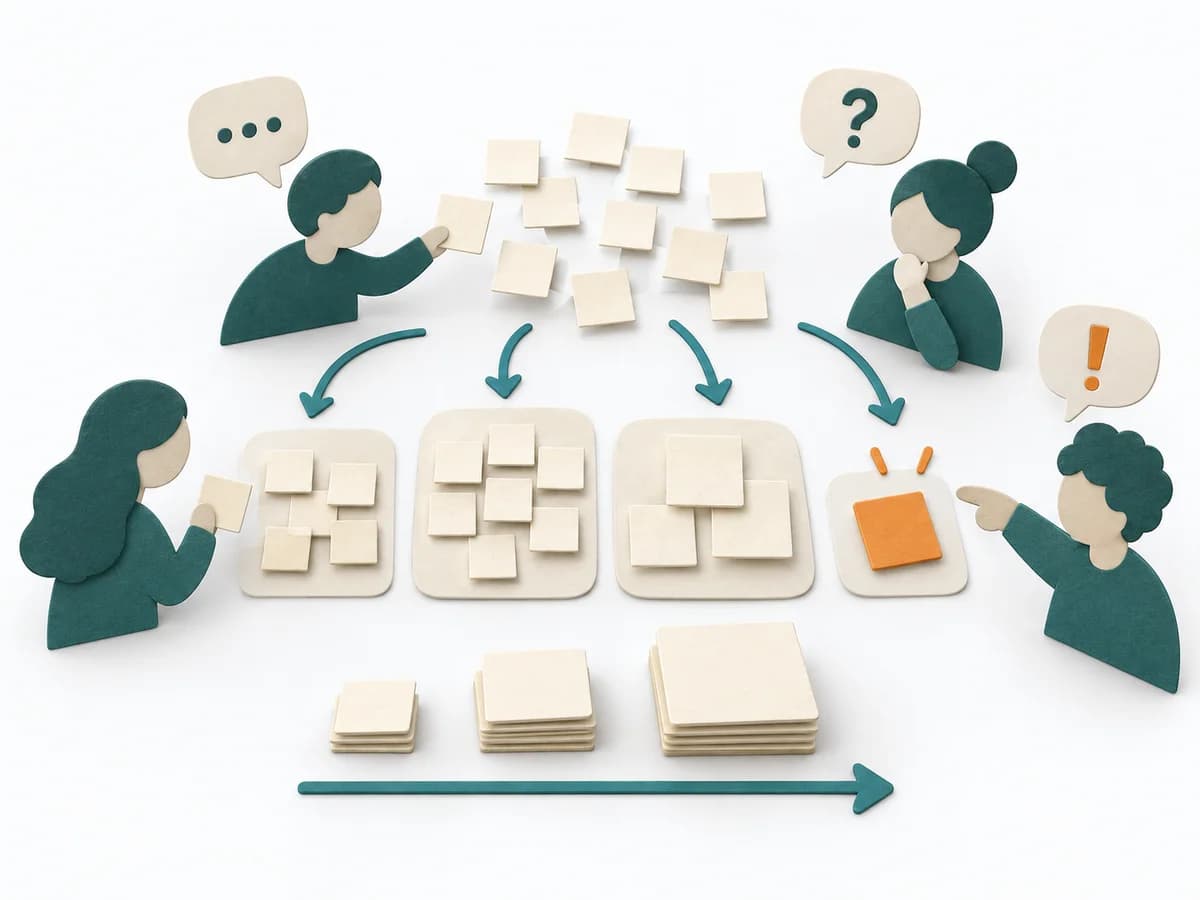 Agile Affinity Estimation | 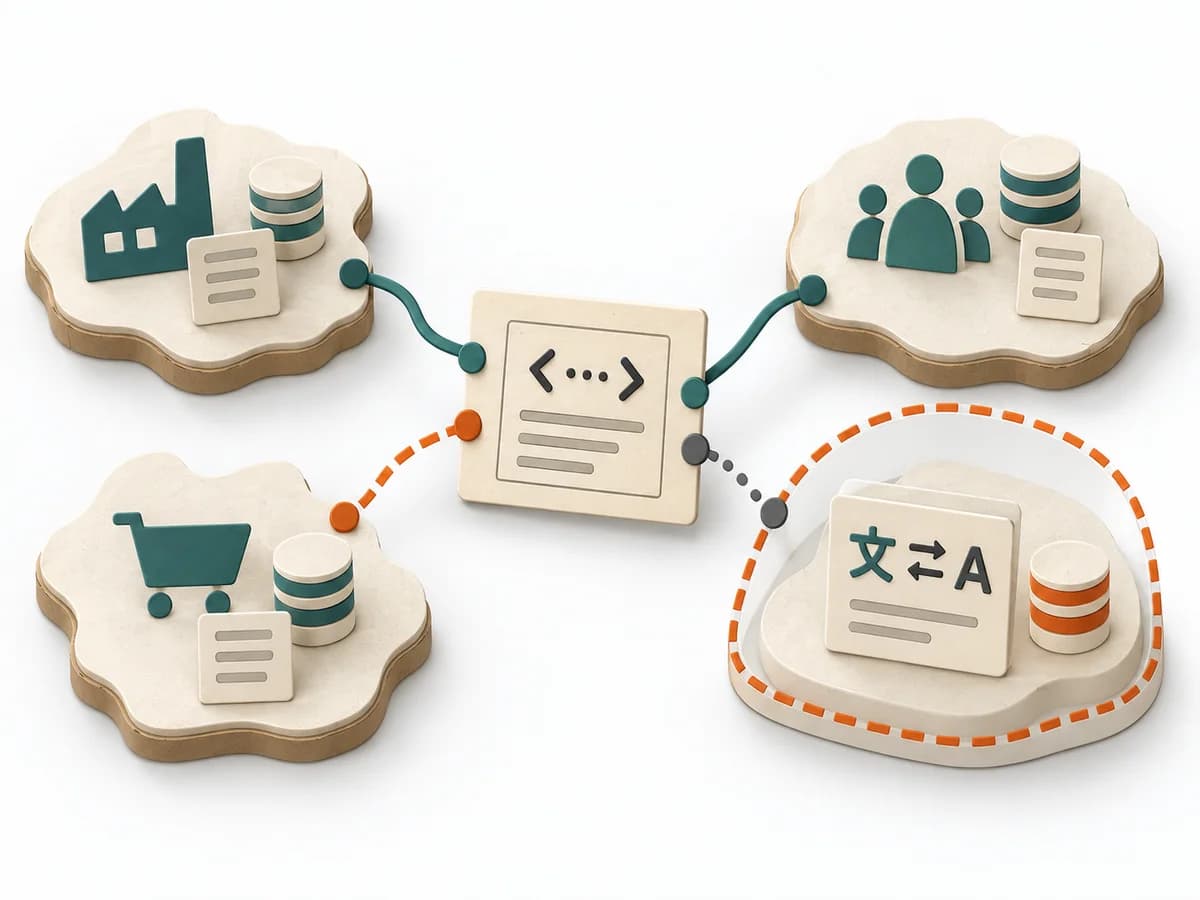 Domain Modeling Context Map |
|---|---|---|---|---|
Purposedifferent | When size or effort can only be estimated roughly, Dot Estimation condenses the group's experience into a quick range. It turns individual contributions into a visible selection. The result is captured as an Effort Heatmap, Risk Signals, and Discussion Targets. | When a business context is still loosely outlined, it shapes language, responsibility, and integration space. It clarifies what belongs together and where a boundary needs to hold. | When many tasks need to be classified quickly, it sorts them by perceived effort and similarity. It reduces the effort of fine-grained estimation for large volumes. | When several contexts need to talk to each other, it makes their relationships and dependencies legible. It helps sort integration pressure and responsibilities across system boundaries. |
Complexitydifferent | Low | Medium | Medium | Medium |
Timedifferent | 5-20 min | 1-3 h | 30-90 min | 1-3 h |
Participantsdifferent | 3-20 | 3-8 | 3-12 | 2-8 |
Formatdifferent | Workshop | Workshop + async | Workshop | Workshop + async |
Outputdifferent | Effort Heatmap, Risk Signals, Discussion Targets | Context Canvas, Glossary, Integration Notes | Affinity Size Map, Grouped Estimates, Unclear Items | Context Map, Integration Patterns, Boundary Notes |
Tagsno overlap | EstimationEffortRisk | Domain-Driven DesignBoundariesModeling | EstimationBacklogRelative sizing | Domain-Driven DesignBoundariesStrategy |