View methods side by side.
Choose up to four methods. Add them using the search and share the comparison by copying its link.
| Criterion | 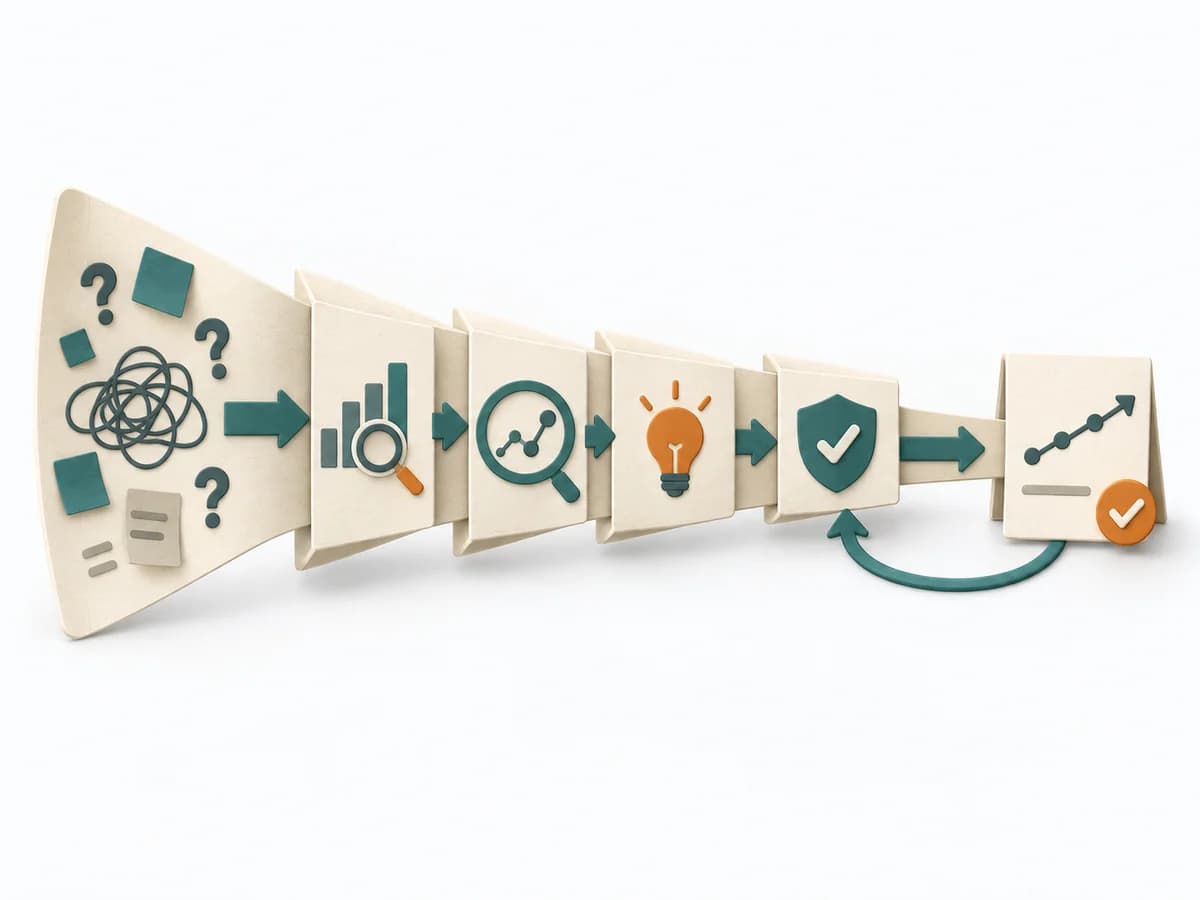 Operations DMAIC |  Operations Fishbone Diagram |  Operations Root Cause Analysis |  Operations Failure Mode and Effects Analysis |
|---|---|---|---|---|
Purposedifferent | For a process problem with fluctuating performance, the method brings analysis and improvement into a disciplined sequence. It creates a framework in which numbers, causes, and control come together. | When a problem has several possible contributing factors, the method sorts causes by cause areas. It prevents an initial hunch from blocking the view of other plausible drivers. | When a problem keeps recurring and the cause stays unclear, the method exposes the underlying mechanism. It separates symptom, guess, and robust explanation from one another. | For a process, product, or service with noticeable failure risks, the method assesses possible failure modes in advance. It directs attention to combinations of occurrence, effect, and detectability. |
Complexitydifferent | High | Low | Medium | High |
Timedifferent | 2-12 Wochen | 30-60 min | 1-4 h | 2-6 h |
Participantsdifferent | 3-10 | 2-8 | 3-8 | 3-10 |
Formatdifferent | Workshop + async | Workshop | Workshop + async | Workshop |
Outputdifferent | Project Charter, Measurement Plan, Cause Analysis, Control Plan | Fishbone Diagram, Cause Categories, Investigation Backlog | Problem Statement, Cause Hypotheses, Confirmed Causes, Action Plan | FMEA Table, Risk Priority, Mitigation Actions |
Tags1 shared | Continuous improvementQualityProcess improvement | Root causeQualityOperations | Root causeProblem solvingQualityIncident | RiskQualityOperationsRoot cause |