View methods side by side.
Choose up to four methods. Add them using the search and share the comparison by copying its link.
| Criterion |  Decision Making Delphi Method |  Systems Thinking Wardley Mapping | 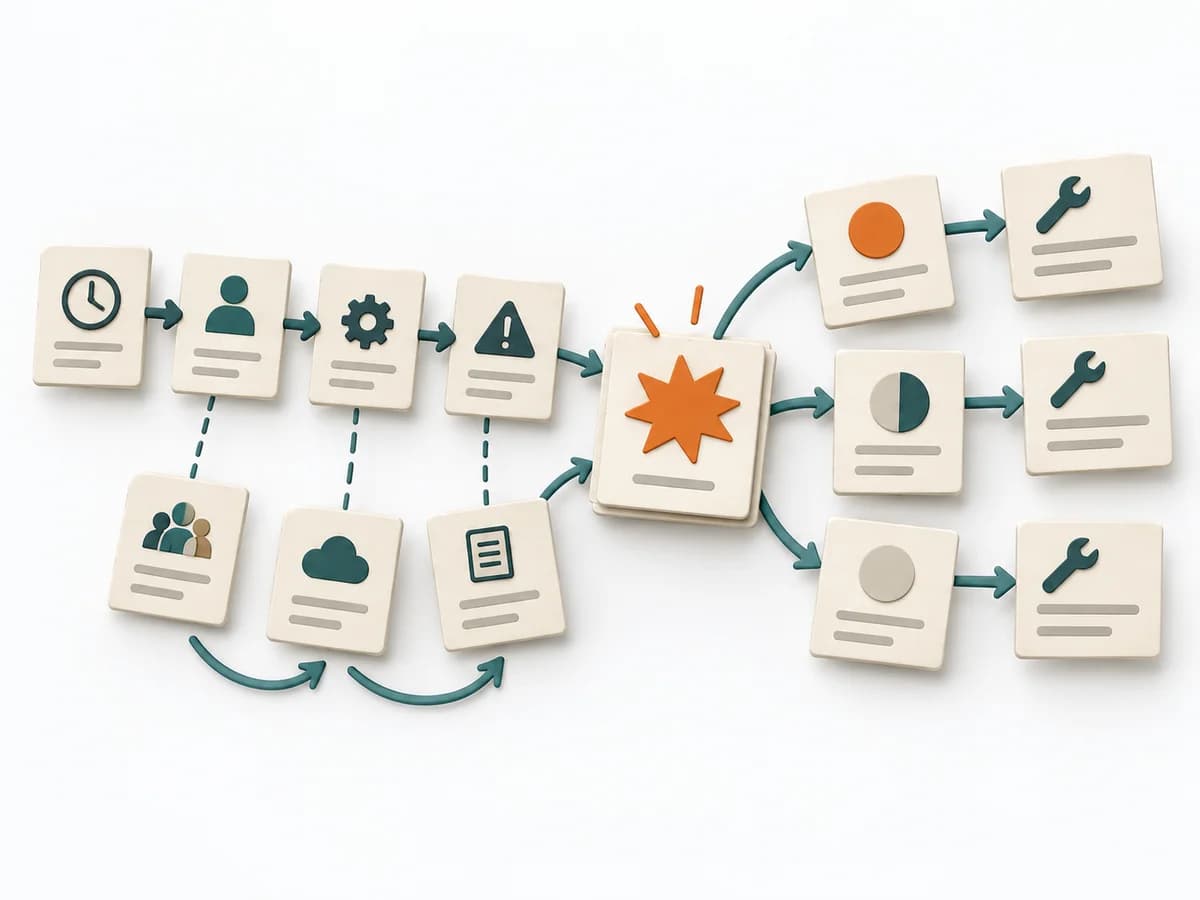 Operations Causal Factor Analysis |  Systems Thinking Causal Loop Diagram |
|---|---|---|---|---|
Purposedifferent | When knowledge is distributed and direct dominance should be avoided, groups quickly fall under the sway of their opinion leaders. The Delphi Method gathers assessments iteratively and gradually brings expert judgments closer together. | Wardley Mapping makes visible where an offering stands today and where it can evolve. The method connects user need, value chain, and evolution stages into a strategic basis for platform, build, or buy decisions. | For an event with a complicated course, the method breaks down the contributing factors along the timeline. It shows how conditions, decisions, and reactions together produce a course of events. | A Causal Loop Diagram makes feedback, reinforcement, and balance in a system legible. It uncovers side effects and self-reinforcement that stay hidden in linear explanations. |
Complexitydifferent | High | Medium | High | Medium |
Timedifferent | 1-4 Wochen | 1-3 h | 2-6 h | 1-3 h |
Participantsdifferent | 6-30 Experten | 2-10 | 3-10 | 2-8 |
Formatdifferent | Async | Workshop + async | Workshop + async | Workshop |
Outputdifferent | Expert Forecast, Consensus Range, Assumption Notes | Wardley Map, Strategic Options, Evolution Notes | Event Timeline, Causal Factor Chart, Cause List, Corrective Actions | Causal Loop Diagram, Feedback Notes, Leverage Points |
Tagsno overlap | ForecastingExpertsDecisionStrategy | StrategySystems thinkingDynamics | CausalityIncidentRoot causeTimeline | FeedbackSystems thinkingCausalityDynamics |