View methods side by side.
Choose up to four methods. Add them using the search and share the comparison by copying its link.
| Criterion | 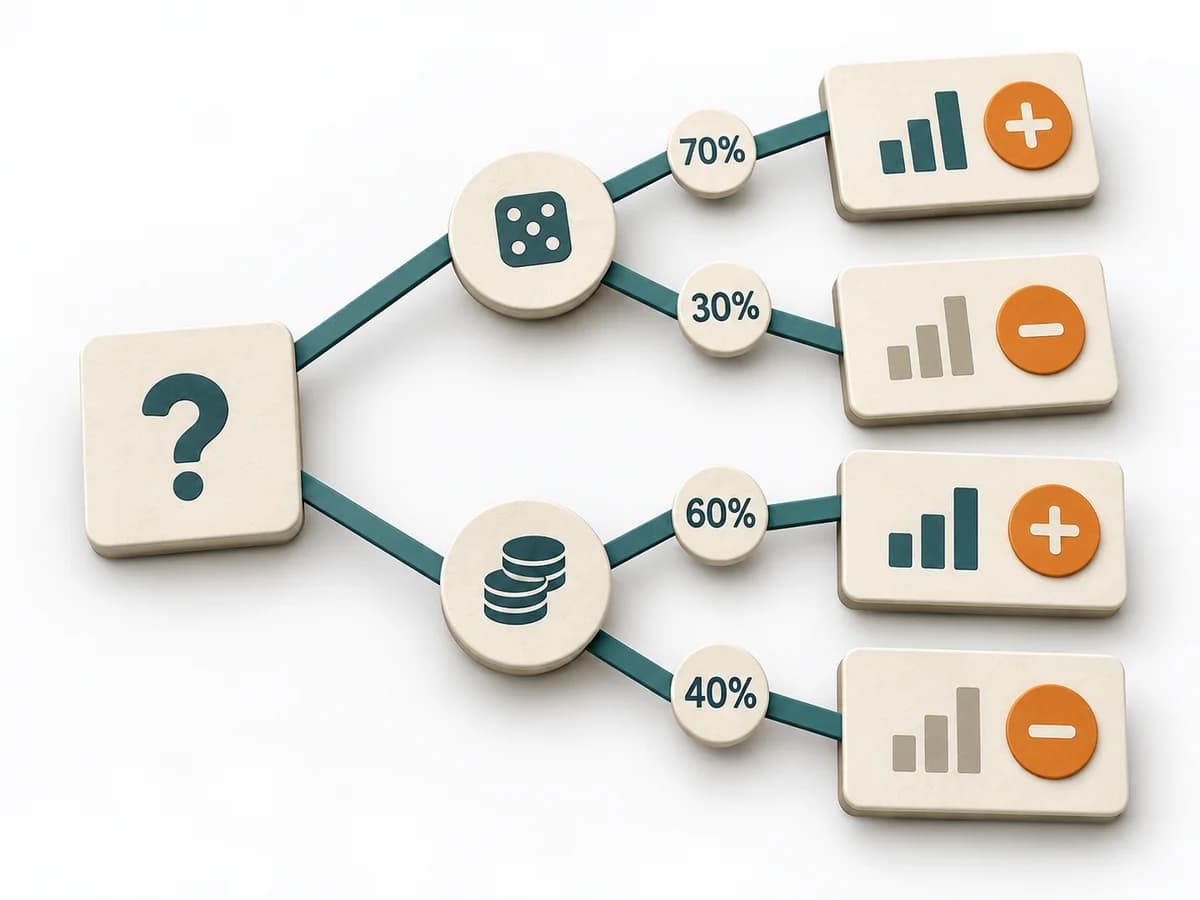 Decision Making Decision Tree |  Operations Fishbone Diagram | 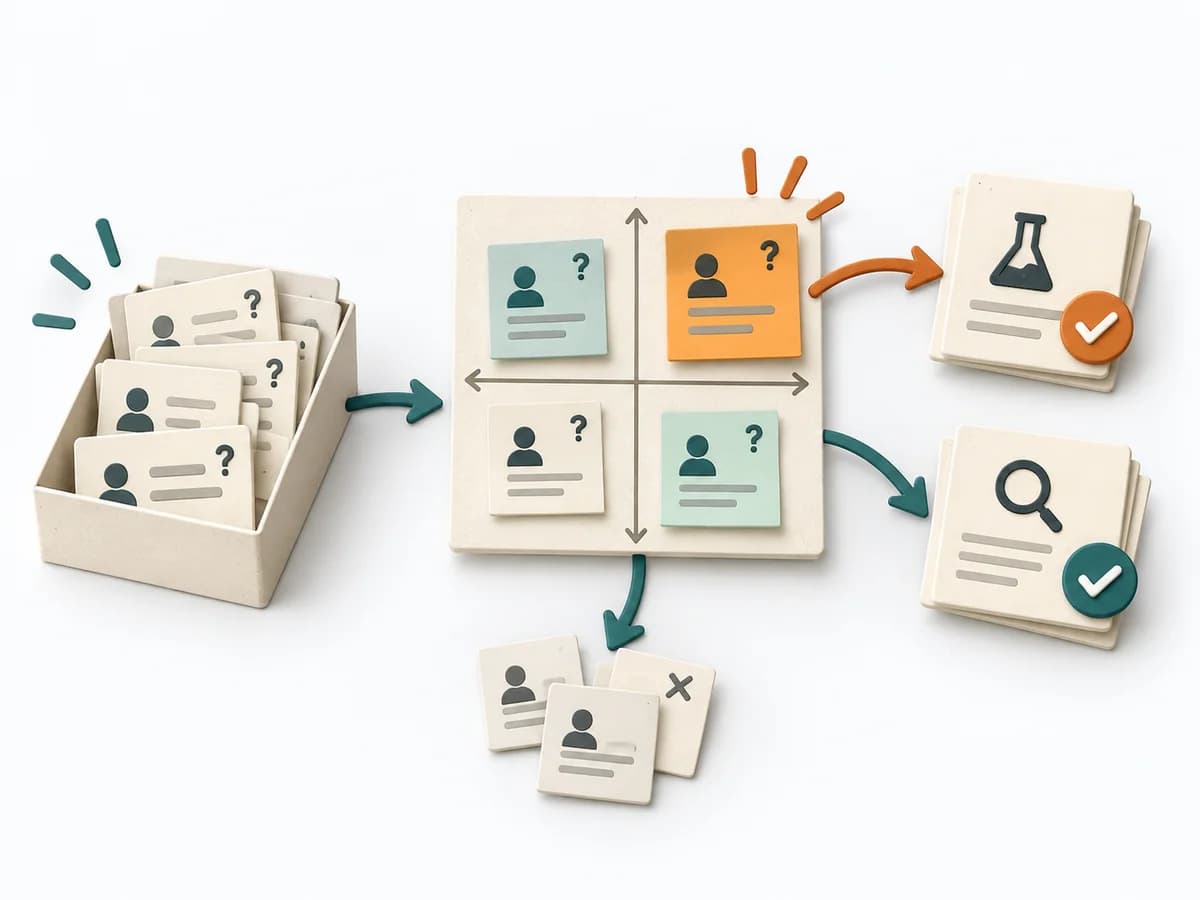 Decision Making Assumption Surfacing | 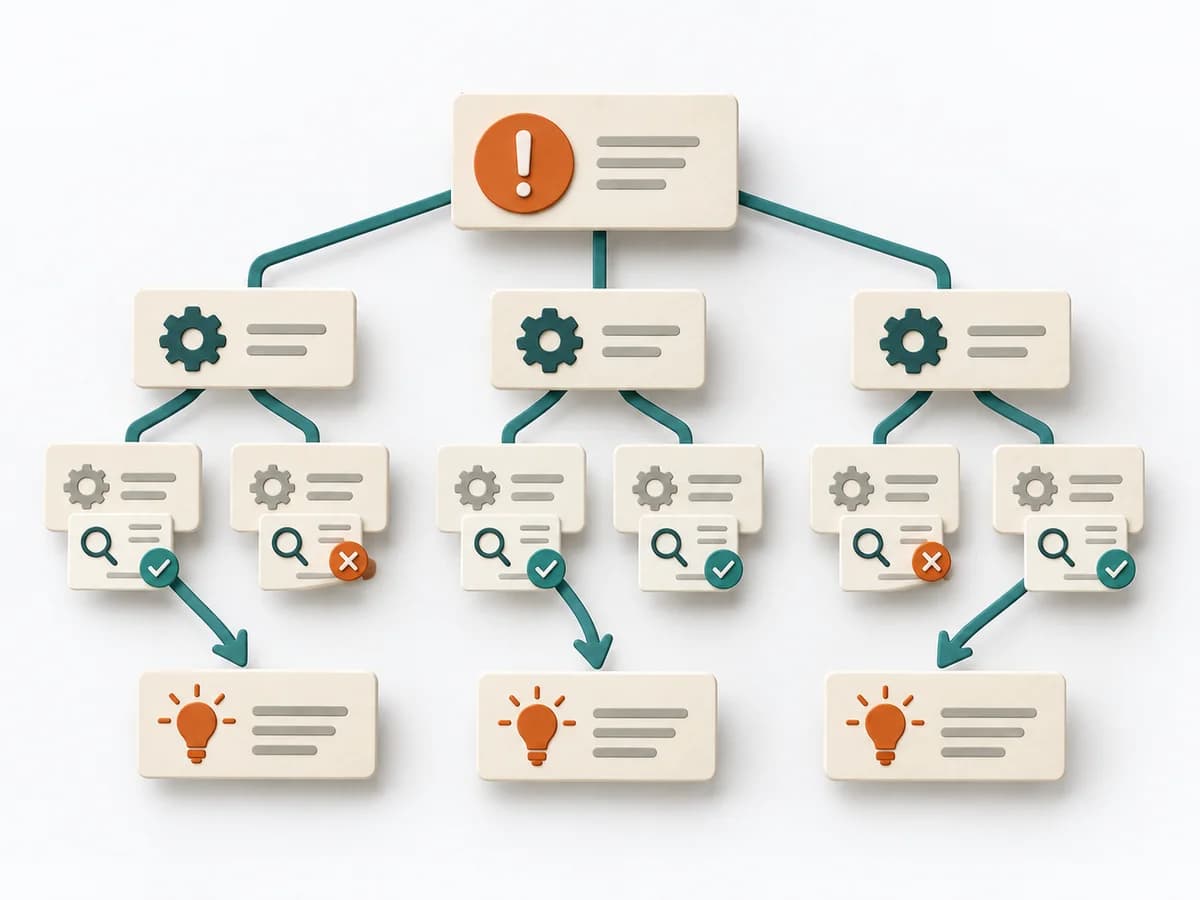 Operations Root Cause Tree Analysis |
|---|---|---|---|---|
Purposedifferent | For decisions with follow-on paths and dependencies, a linear comparison is often not enough. A Decision Tree shows how options branch under conditions and which consequences hang on each branch. | When a problem has several possible contributing factors, the method sorts causes by cause areas. It prevents an initial hunch from blocking the view of other plausible drivers. | Plans often contain assumptions that were never openly stated and remain dangerous precisely because of that. Assumption Surfacing makes these silent premises visible and prioritizes which of them carry the initiative or could sink it. | For a problem with several suspected causes, the method builds a causal structure instead of a mere list. It makes visible how causes connect and where the strongest points of leverage lie. |
Complexitydifferent | Medium | Low | Low | Medium |
Timedifferent | 30-90 min | 30-60 min | 45-90 min | 1-3 h |
Participantsdifferent | 1-6 | 2-8 | 2-8 | 2-8 |
Formatdifferent | Workshop + async | Workshop | Workshop + async | Workshop |
Outputdifferent | Decision Tree, Option Map, Assumption List | Fishbone Diagram, Cause Categories, Investigation Backlog | Assumption List, Critical Assumptions, Learning Plan | Cause Tree, Evidence Notes, Countermeasures |
Tagsno overlap | DecisionTreeOptions | Root causeQualityOperations | AssumptionsRiskDecisionDiscovery | Root causeTreeIncidentQuality |