View methods side by side.
Choose up to four methods. Add them using the search and share the comparison by copying its link.
| Criterion | 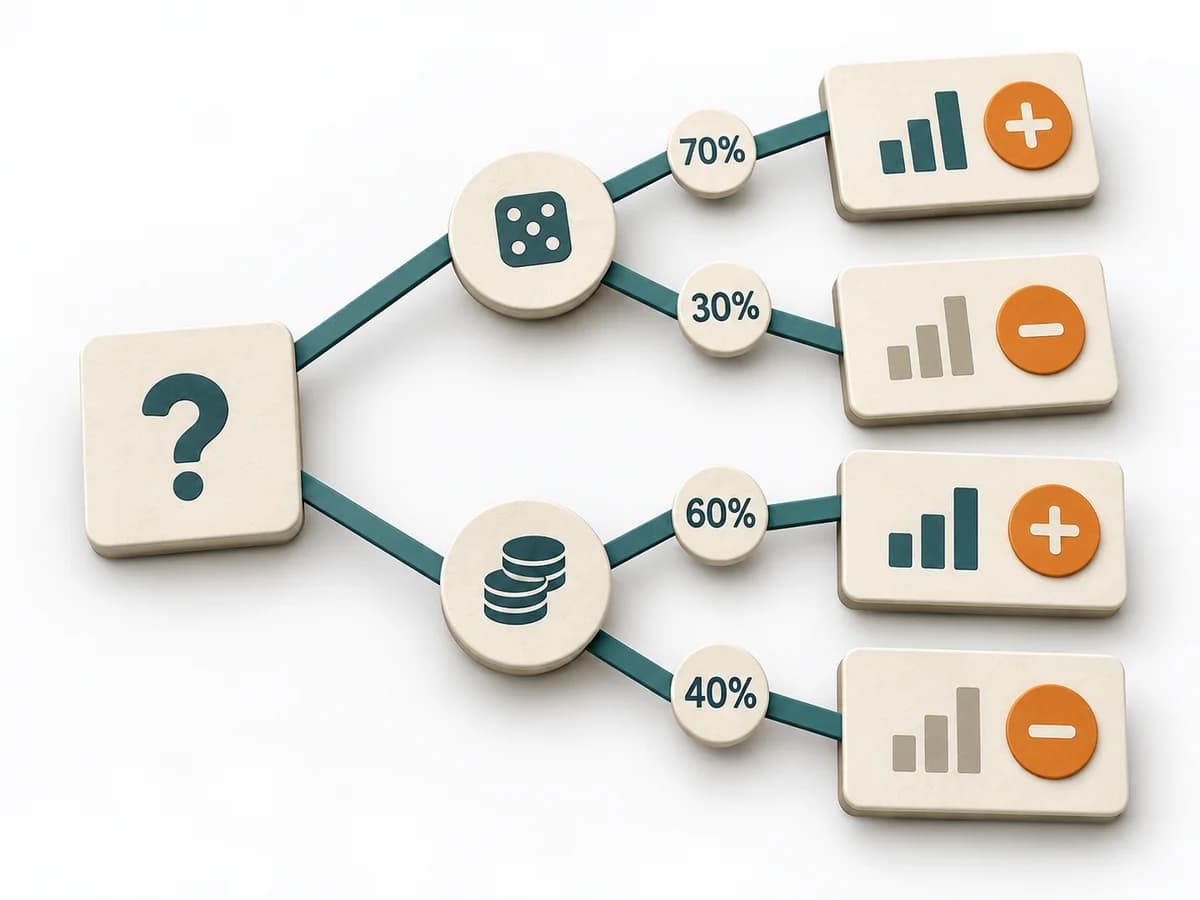 Decision Making Decision Tree | 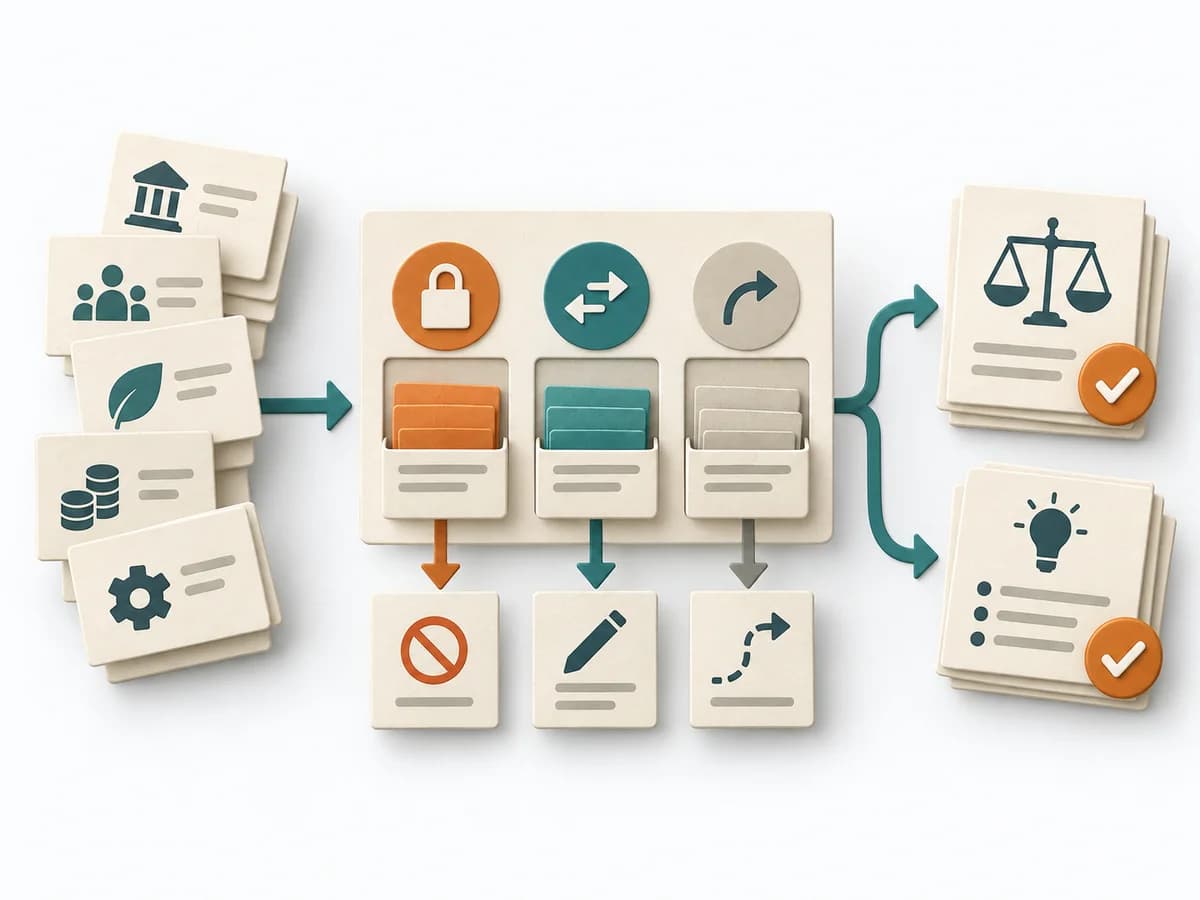 Decision Making Constraint Analysis | 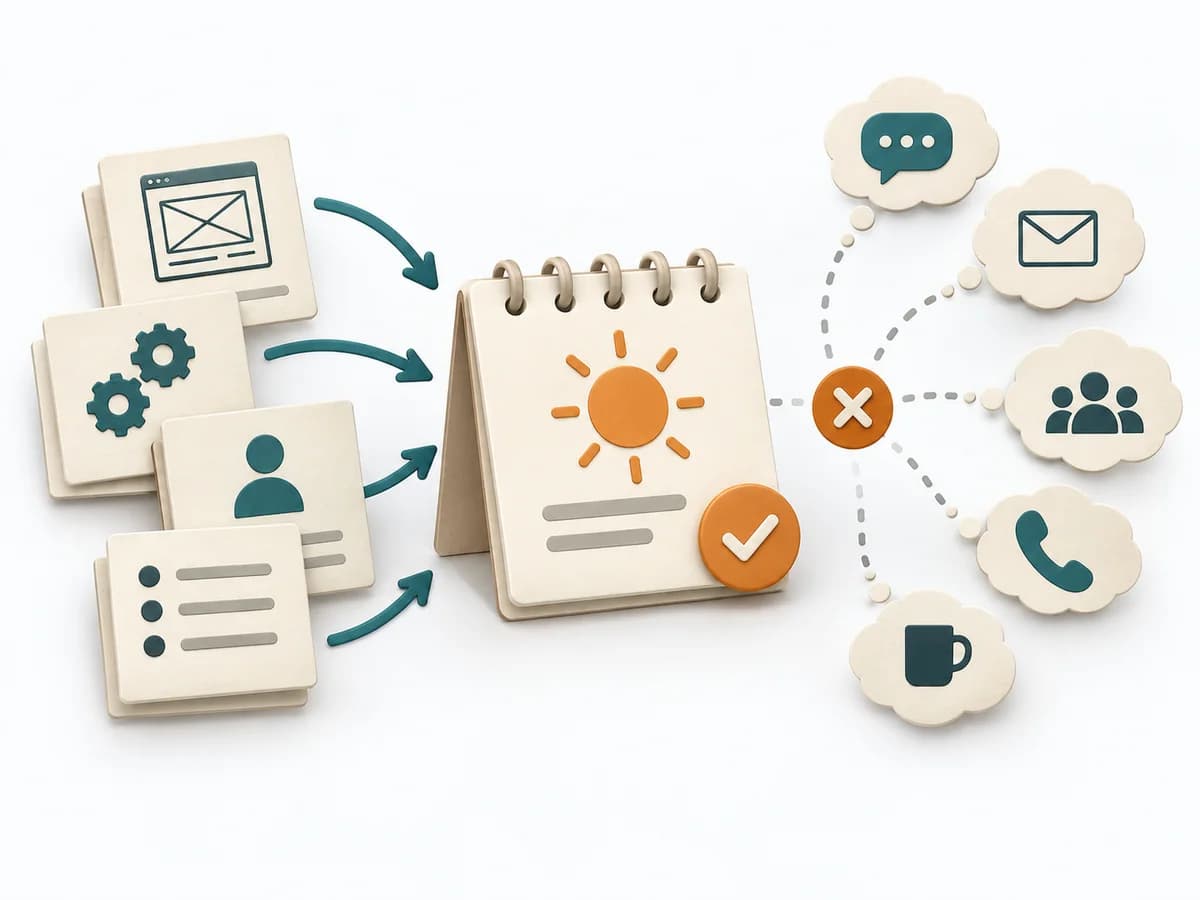 Agile Ideal Days |  Facilitation Dot Estimation |
|---|---|---|---|---|
Purposedifferent | For decisions with follow-on paths and dependencies, a linear comparison is often not enough. A Decision Tree shows how options branch under conditions and which consequences hang on each branch. | When an initiative stalls, the limit often lies not in the idea but in hard or soft boundary conditions. Constraint Analysis separates these limits and shows which of them can actually be shaped. | When effort needs to be thought of as real working time, it offers a simple common denominator for comparison. It sorts work by value, risk, and delivery ability. The result is captured as Ideal Day Estimates, Assumption Notes, and Capacity Caveats. | When size or effort can only be estimated roughly, Dot Estimation condenses the group's experience into a quick range. It turns individual contributions into a visible selection. The result is captured as an Effort Heatmap, Risk Signals, and Discussion Targets. |
Complexitydifferent | Medium | Low | Low | Low |
Timedifferent | 30-90 min | 30-90 min | 15-60 min | 5-20 min |
Participantsdifferent | 1-6 | 2-8 | 2-9 | 3-20 |
Formatdifferent | Workshop + async | Workshop + async | Workshop + async | Workshop |
Outputdifferent | Decision Tree, Option Map, Assumption List | Constraint List, Hard/Soft Classification, Option Impact Notes, Decision Boundaries | Ideal Day Estimates, Assumption Notes, Capacity Caveats | Effort Heatmap, Risk Signals, Discussion Targets |
Tagsno overlap | DecisionTreeOptions | ConstraintsDecisionPlanningOptions | EstimationEffortAgile | EstimationEffortRisk |