View methods side by side.
Choose up to four methods. Add them using the search and share the comparison by copying its link.
| Criterion | 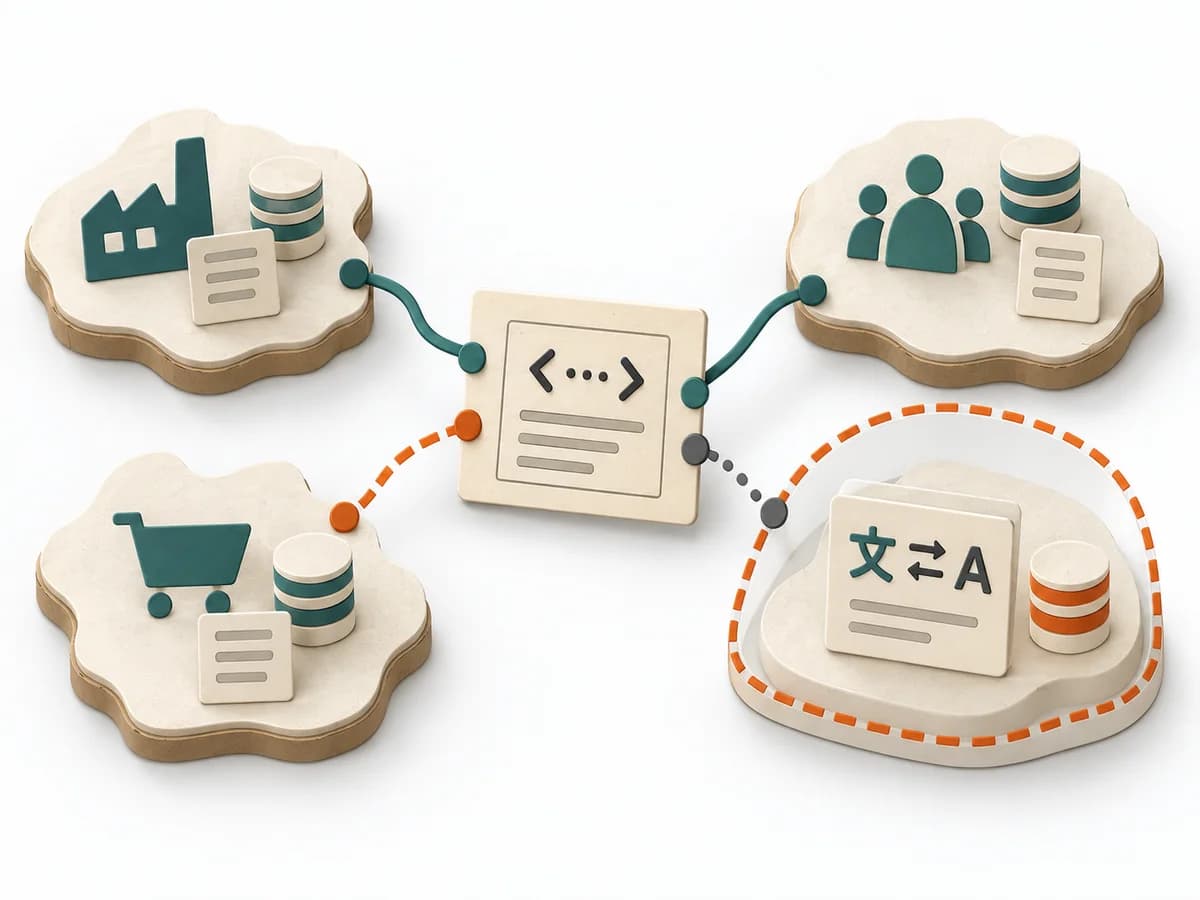 Domain Modeling Context Map |  Facilitation Dot Estimation | 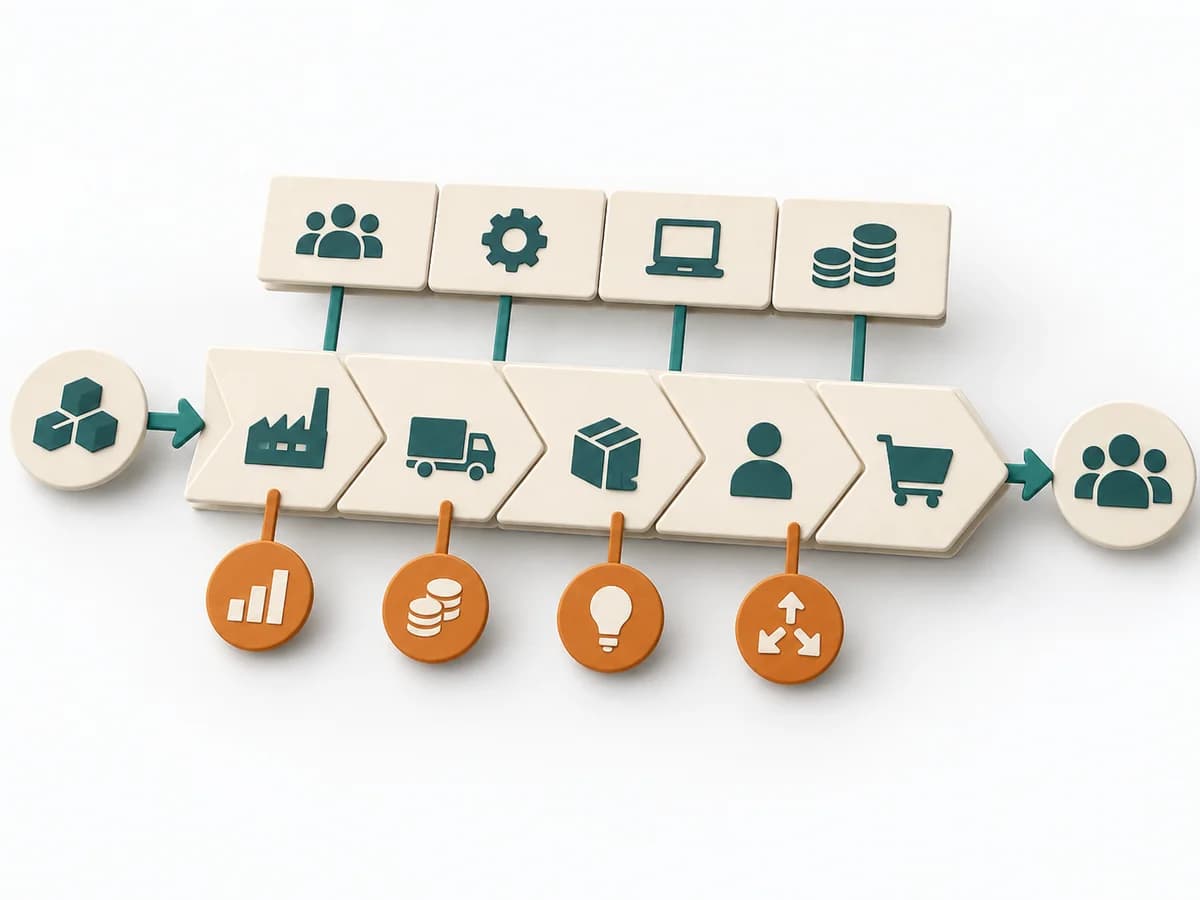 Business Strategy Value Chain Analysis | 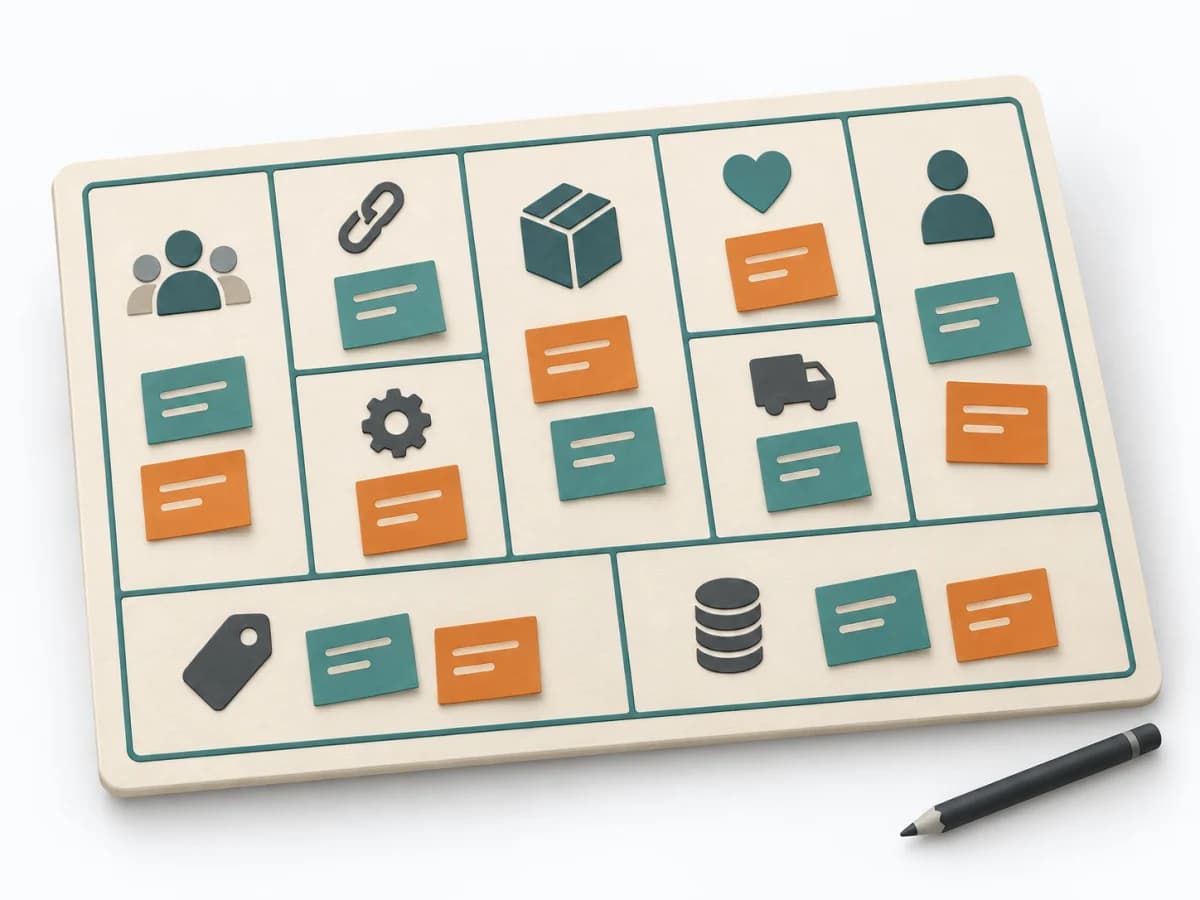 Business Strategy Business Model Canvas |
|---|---|---|---|---|
Purposedifferent | When several contexts need to talk to each other, it makes their relationships and dependencies legible. It helps sort integration pressure and responsibilities across system boundaries. | When size or effort can only be estimated roughly, Dot Estimation condenses the group's experience into a quick range. It turns individual contributions into a visible selection. The result is captured as an Effort Heatmap, Risk Signals, and Discussion Targets. | Value Chain Analysis shows where value is created, costs accrue, and differentiation becomes possible along the process. It compares strengths, risks, market logic, and courses of action. The result is captured as a value-chain map and lever list. | The Business Model Canvas condenses a business model to its key building blocks and assumptions. It makes variants quickly comparable and reveals gaps before validation or implementation begins. |
Complexitydifferent | Medium | Low | High | Medium |
Timedifferent | 1-3 h | 5-20 min | Half day | 1-2 h |
Participantsdifferent | 2-8 | 3-20 | 3-8 | 2-8 |
Formatdifferent | Workshop + async | Workshop | Workshop | Workshop + async |
Outputdifferent | Context Map, Integration Patterns, Boundary Notes | Effort Heatmap, Risk Signals, Discussion Targets | Value Chain Map, Lever List | Business Model Canvas, Assumption List, Business Hypotheses |
Tagsno overlap | Domain-Driven DesignBoundariesStrategy | EstimationEffortRisk | StrategyBusiness modelDiagnosisAnalysis | Business modelStrategyValueInnovation |