View methods side by side.
Choose up to four methods. Add them using the search and share the comparison by copying its link.
| Criterion | 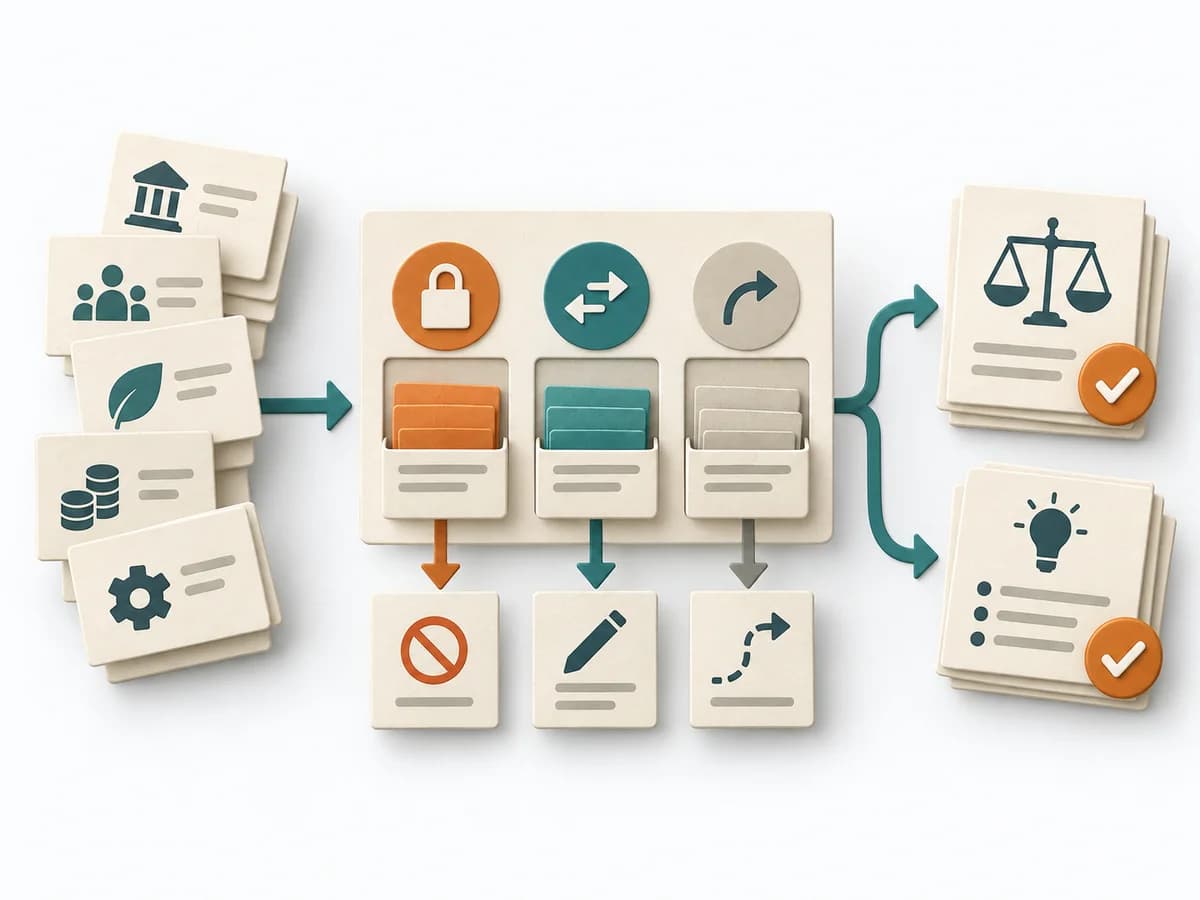 Decision Making Constraint Analysis |  Operations Change Analysis |  Systems Thinking Behavior Over Time Graph |  Systems Thinking Causal Loop Diagram |
|---|---|---|---|---|
Purposedifferent | When an initiative stalls, the limit often lies not in the idea but in hard or soft boundary conditions. Constraint Analysis separates these limits and shows which of them can actually be shaped. | For a deviation after a change, the method isolates the influence of the altered condition. It narrows down which differences are relevant and which are just accompanying noise. | A Behavior Over Time Graph shows how a metric or observation develops over time. The method makes trends, breaks, and recurring patterns visible that get lost in snapshots. | A Causal Loop Diagram makes feedback, reinforcement, and balance in a system legible. It uncovers side effects and self-reinforcement that stay hidden in linear explanations. |
Complexitydifferent | Low | Medium | Low | Medium |
Timedifferent | 30-90 min | 45-120 min | 20-45 min | 1-3 h |
Participantsdifferent | 2-8 | 2-6 | 1-10 | 2-8 |
Formatdifferent | Workshop + async | Workshop + async | Workshop + async | Workshop |
Outputdifferent | Constraint List, Hard/Soft Classification, Option Impact Notes, Decision Boundaries | Change Matrix, Cause Hypotheses, Validation Questions, Action List | Behavior Over Time Graph, Trend Hypotheses, Key Events | Causal Loop Diagram, Feedback Notes, Leverage Points |
Tagsno overlap | ConstraintsDecisionPlanningOptions | ChangeRoot causeTroubleshootingComparison | Systems thinkingPatternsDynamics | FeedbackSystems thinkingCausalityDynamics |