View methods side by side.
Choose up to four methods. Add them using the search and share the comparison by copying its link.
| Criterion | 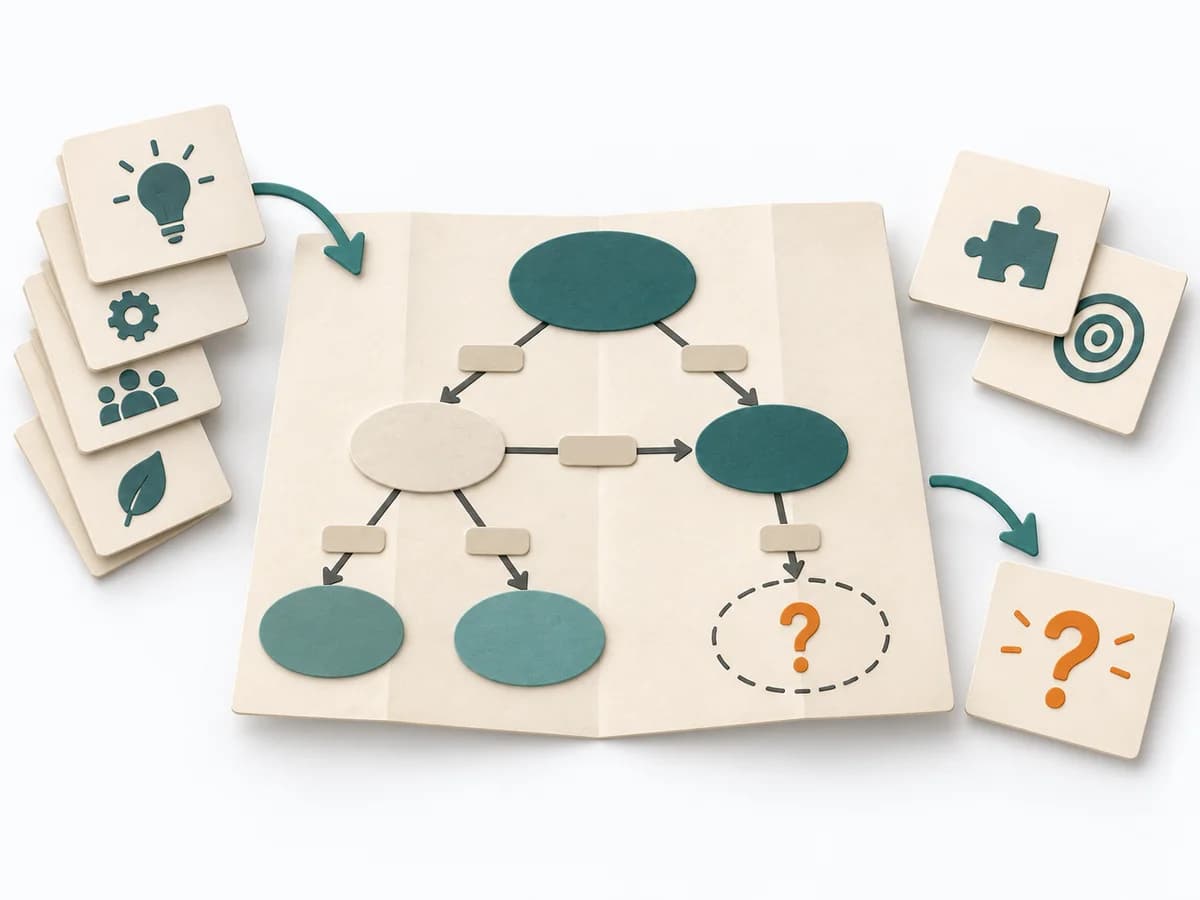 Knowledge Modeling Concept Mapping |  Product Strategy KPI Tree | 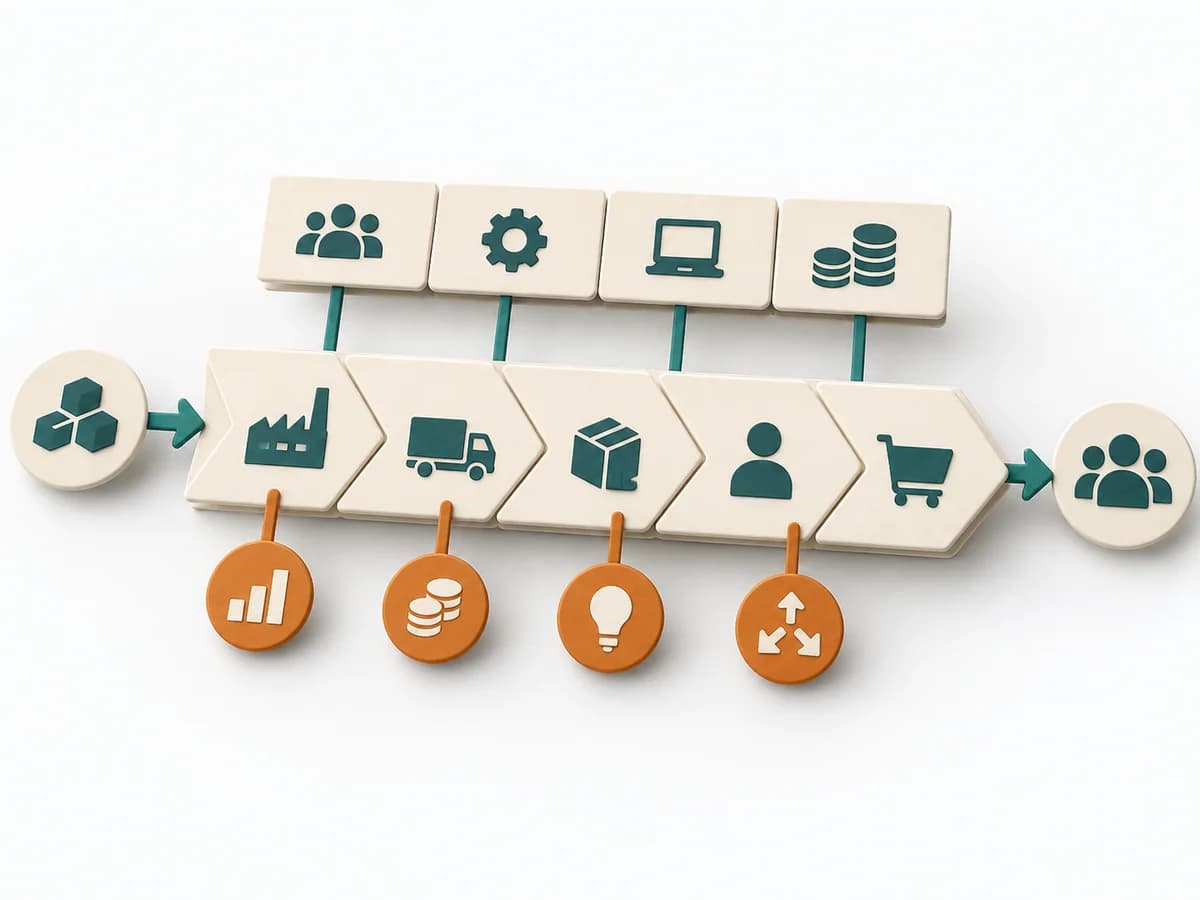 Business Strategy Value Chain Analysis | 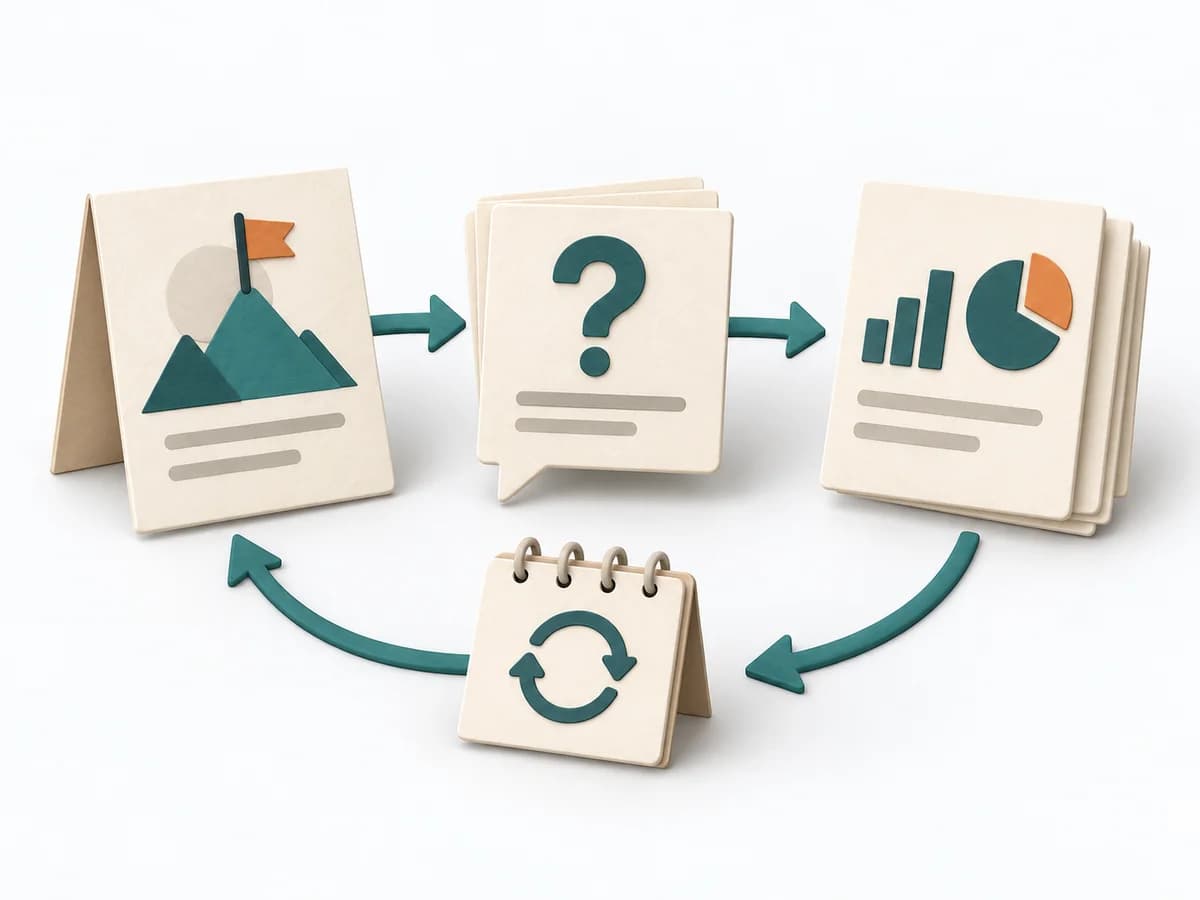 Engineering Goal Question Metric |
|---|---|---|---|---|
Purposedifferent | Concept Mapping arranges terms and relationships in a network that makes subject-matter connections tangible. It fits when a topic needs to be understood structurally rather than linearly. | When metrics across the organization drift apart, it arranges drivers and effects under one shared logic. It connects customer value, product logic, and decision priorities. The result is captured as a KPI tree and owner list. | Value Chain Analysis shows where value is created, costs accrue, and differentiation becomes possible along the process. It compares strengths, risks, market logic, and courses of action. The result is captured as a value-chain map and lever list. | Helps clarify technical problems, hypotheses, and next steps in concrete terms. It breaks a technical problem into testable parts. The result is captured as a GQM table and metric briefs. |
Complexitydifferent | Medium | Medium | High | Medium |
Timedifferent | 1-2 h | 90-180 min initial, dann laufend | Half day | 90-180 min |
Participantsdifferent | 1-8 | 3-8 | 3-8 | 3-6 |
Formatdifferent | Workshop + async | Workshop + async | Workshop | Workshop |
Outputdifferent | Concept Map, Relationship Labels, Knowledge Gaps | KPI Tree, Owner List | Value Chain Map, Lever List | GQM Table, Metric Profiles |
Tagsno overlap | KnowledgeConceptsMappingSensemaking | MetricsStrategyAlignmentMeasurement | StrategyBusiness modelDiagnosisAnalysis | MetricsMeasurementEngineeringAlignment |