View methods side by side.
Choose up to four methods. Add them using the search and share the comparison by copying its link.
| Criterion | 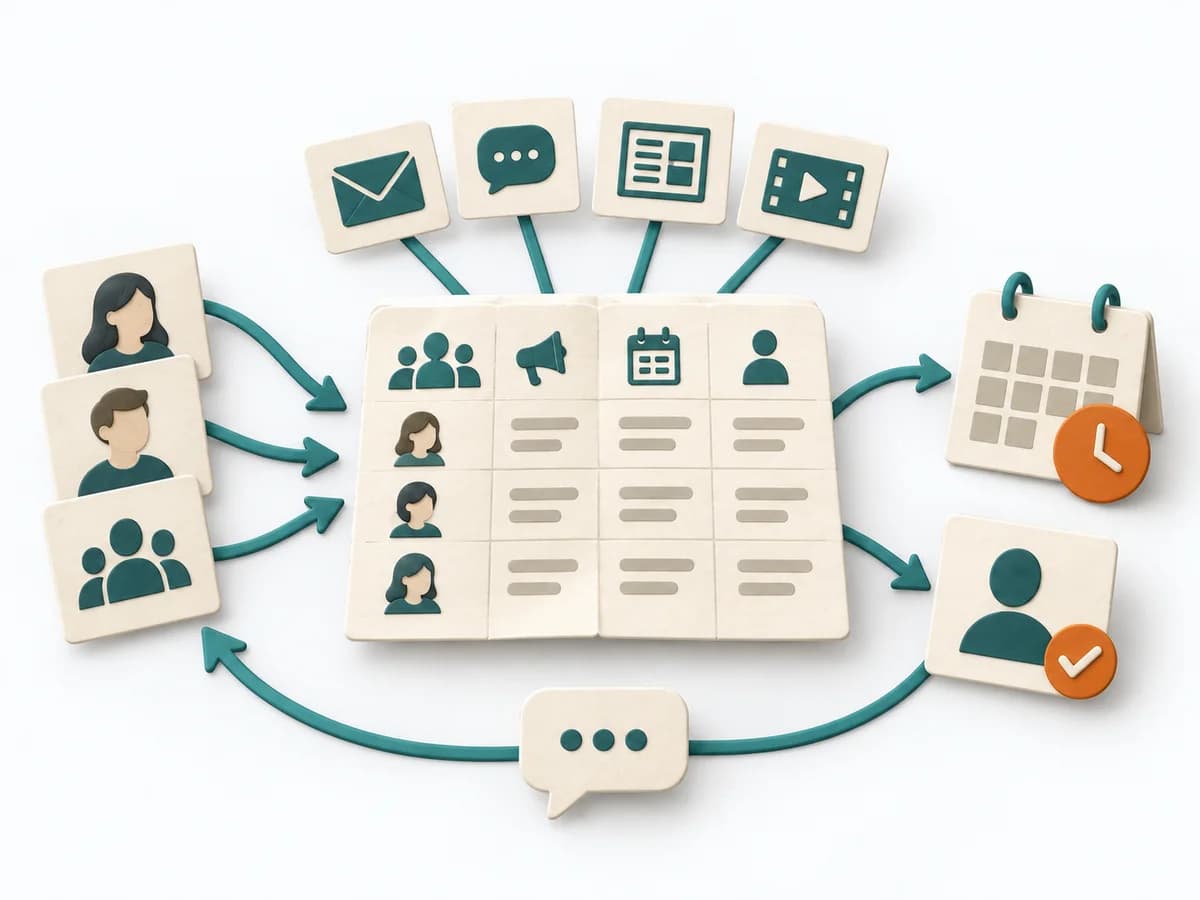 Delivery Communication Plan |  Operations Fishbone Diagram |  Operations Scatter Diagram |  Operations Failure Mode and Effects Analysis |
|---|---|---|---|---|
Purposedifferent | When many people need to be informed in parallel and messages would otherwise arrive unevenly or too late, a Communication Plan orders communication reliably. Channels, audiences, and cadences interlock so important information doesn't get lost. | When a problem has several possible contributing factors, the method sorts causes by cause areas. It prevents an initial hunch from blocking the view of other plausible drivers. | When the question is whether two measures are related, the method makes patterns in the data picture visible. It separates felt correlations from relationships that actually show up in the data. | For a process, product, or service with noticeable failure risks, the method assesses possible failure modes in advance. It directs attention to combinations of occurrence, effect, and detectability. |
Complexitydifferent | Low | Low | Low | High |
Timedifferent | 45-90 min | 30-60 min | 30-90 min | 2-6 h |
Participantsdifferent | 2-6 | 2-8 | 1-4 | 3-10 |
Formatdifferent | Workshop + async | Workshop | Workshop + async | Workshop |
Outputdifferent | Communication Plan, Channel Matrix, Message Cadence | Fishbone Diagram, Cause Categories, Investigation Backlog | Scatter Plot, Korrelationsnotiz, Hypothesenliste | FMEA Table, Risk Priority, Mitigation Actions |
Tagsno overlap | CommunicationStakeholdersDeliveryPlanning | Root causeQualityOperations | Root causeQualityVisualization | RiskQualityOperationsRoot cause |