View methods side by side.
Choose up to four methods. Add them using the search and share the comparison by copying its link.
| Criterion | 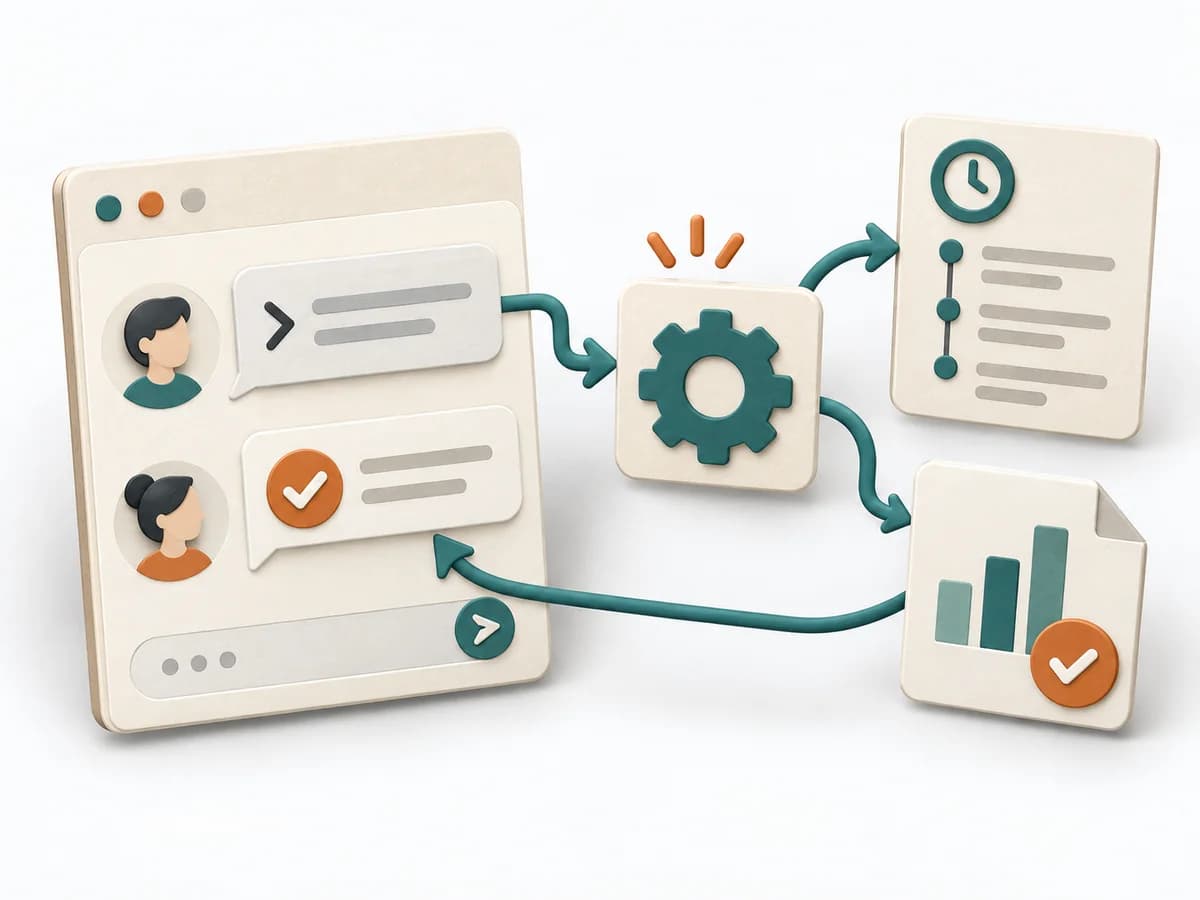 DevOps ChatOps | 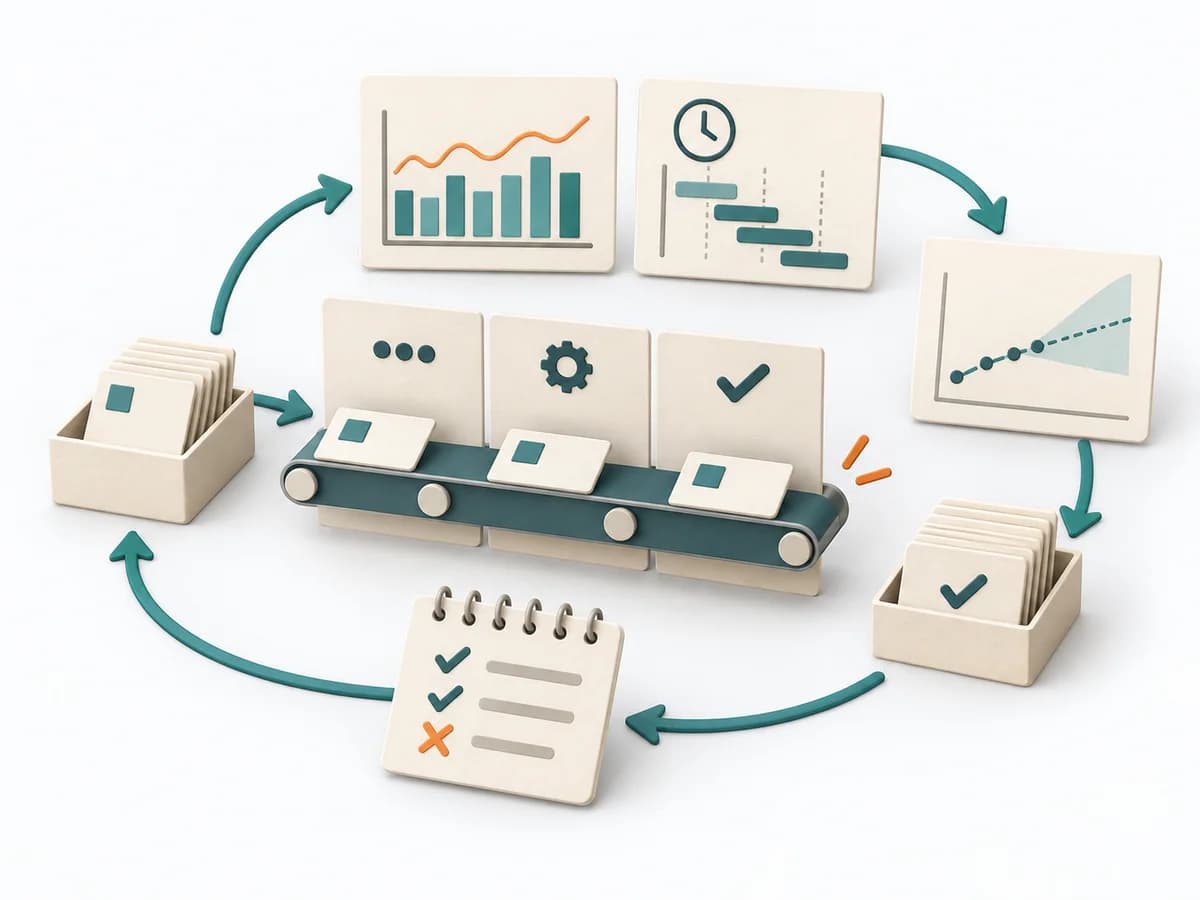 Agile NoEstimates | 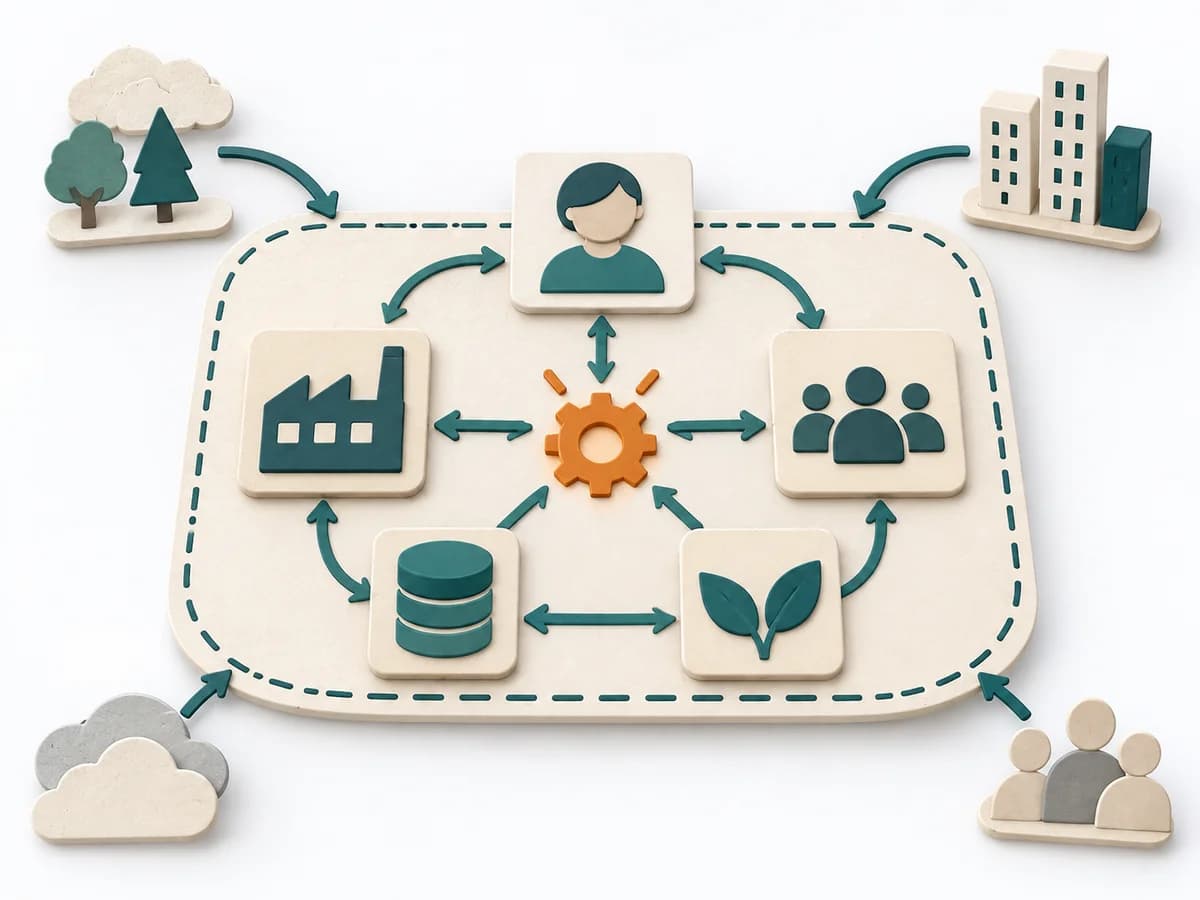 Systems Thinking Systems Mapping |  Delivery Monte Carlo Forecasting |
|---|---|---|---|---|
Purposedifferent | For operational work in a distributed team, the method links communication with direct system control. It records decisions right where the signal, the context, and the execution come together. | When estimating slows a team down more than it helps, it shifts the focus to flow, small slices, and real lead time. It sorts work by value, risk, and delivery ability. The result is captured as Throughput Data, Flow Forecast, and Slicing Rules. | Systems Mapping arranges elements, relationships, and boundaries so a complex field becomes legible at a glance. The overview stabilizes the overall picture before detail work or steering begins. | Helps clarify scope, sequence, and delivery flow in concrete terms. It makes work, boundaries, and order steerable. The result is captured as Forecast Percentiles, Throughput Dataset, and Risk Communication. |
Complexitydifferent | Medium | Medium | Medium | High |
Timedifferent | Ongoing | laufend | 1-3 h | 30-90 min Setup, danach laufend |
Participantsdifferent | 2-20 | 2-12 | 3-12 | 1-8 |
Formatsame | Workshop + async | Workshop + async | Workshop + async | Workshop + async |
Outputdifferent | Chat Transcript, Action Log, Automations | Throughput Data, Flow Forecast, Slicing Rules | System Map, Dependencies, Leverage Points | Forecast Percentiles, Throughput Dataset, Risk Communication |
Tagsno overlap | CollaborationEngineeringIncident | EstimationForecastingFlow | Systems thinkingMappingBoundariesChange | ForecastingFlowDelivery |