View methods side by side.
Choose up to four methods. Add them using the search and share the comparison by copying its link.
| Criterion |  Operations Change Analysis |  Agile NoEstimates | 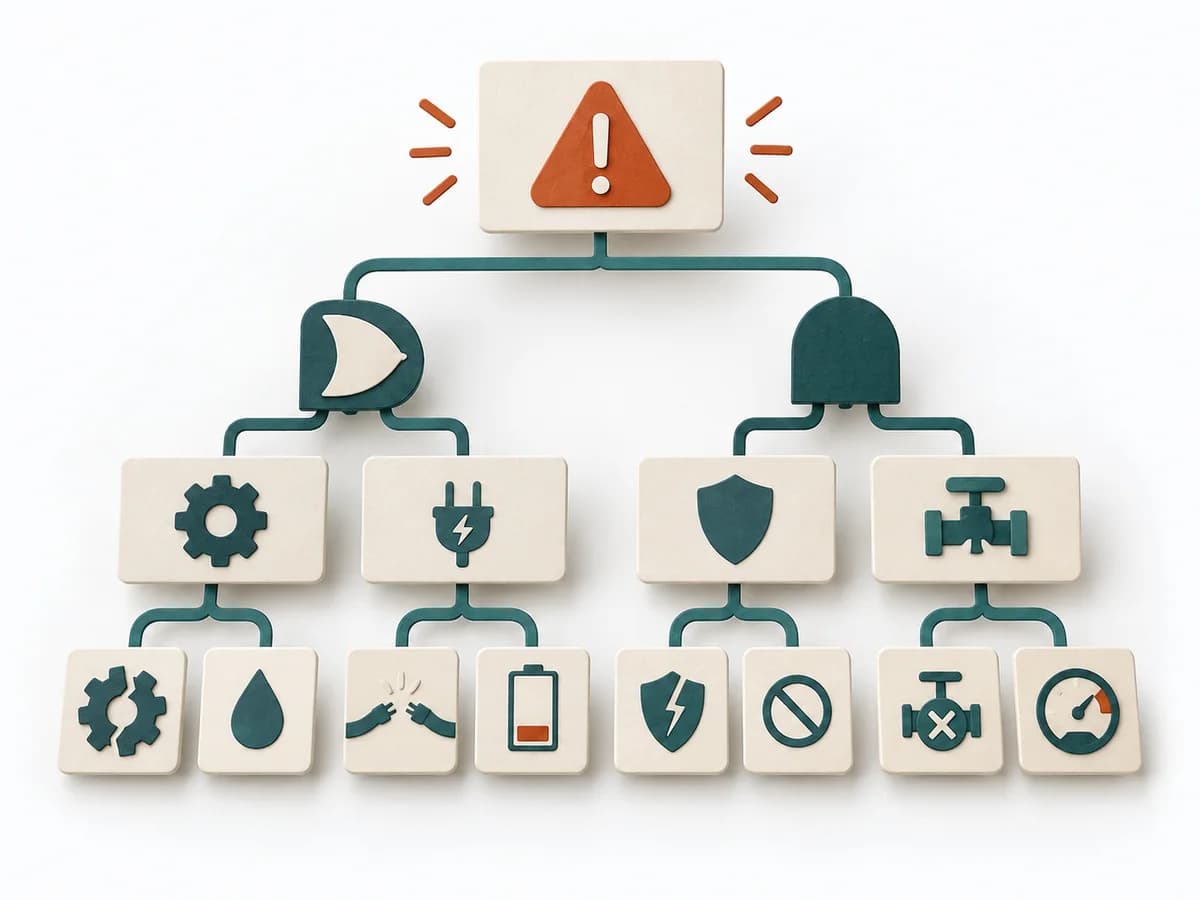 Operations Fault Tree Analysis |  Delivery Monte Carlo Forecasting |
|---|---|---|---|---|
Purposedifferent | For a deviation after a change, the method isolates the influence of the altered condition. It narrows down which differences are relevant and which are just accompanying noise. | When estimating slows a team down more than it helps, it shifts the focus to flow, small slices, and real lead time. It sorts work by value, risk, and delivery ability. The result is captured as Throughput Data, Flow Forecast, and Slicing Rules. | For a critical top event with several possible triggers, the method logically models failure paths. It makes visible which combinations of conditions can lead to damage. | Helps clarify scope, sequence, and delivery flow in concrete terms. It makes work, boundaries, and order steerable. The result is captured as Forecast Percentiles, Throughput Dataset, and Risk Communication. |
Complexitydifferent | Medium | Medium | High | High |
Timedifferent | 45-120 min | laufend | 2-6 h | 30-90 min Setup, danach laufend |
Participantsdifferent | 2-6 | 2-12 | 3-8 | 1-8 |
Formatsame | Workshop + async | Workshop + async | Workshop + async | Workshop + async |
Outputdifferent | Change Matrix, Cause Hypotheses, Validation Questions, Action List | Throughput Data, Flow Forecast, Slicing Rules | Fault Tree, Critical Paths, Cause Hypotheses, Control Actions | Forecast Percentiles, Throughput Dataset, Risk Communication |
Tagsno overlap | ChangeRoot causeTroubleshootingComparison | EstimationForecastingFlow | RiskRoot causeSafety | ForecastingFlowDelivery |