View methods side by side.
Choose up to four methods. Add them using the search and share the comparison by copying its link.
| Criterion |  Systems Thinking Causal Loop Diagram | 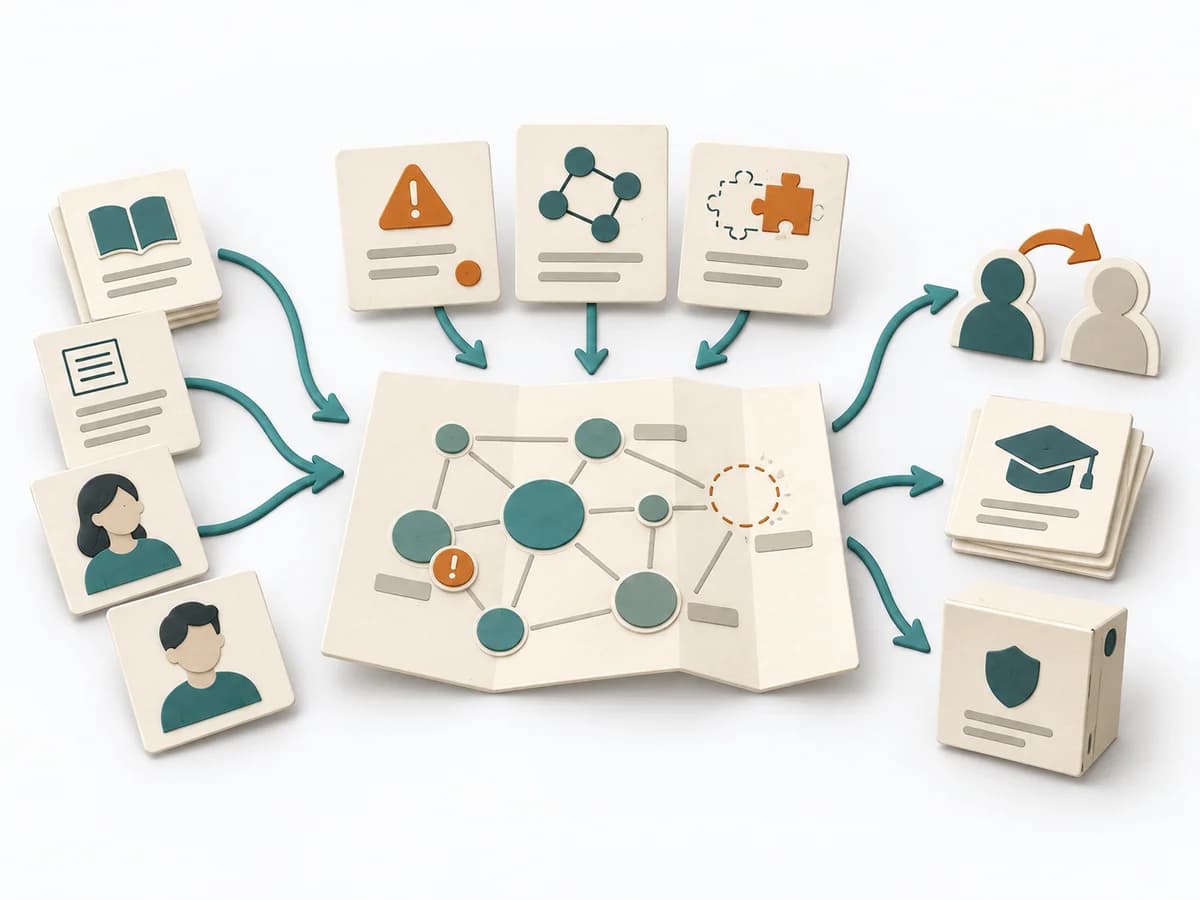 Knowledge Modeling Knowledge Mapping |  Decision Making Red Teaming | 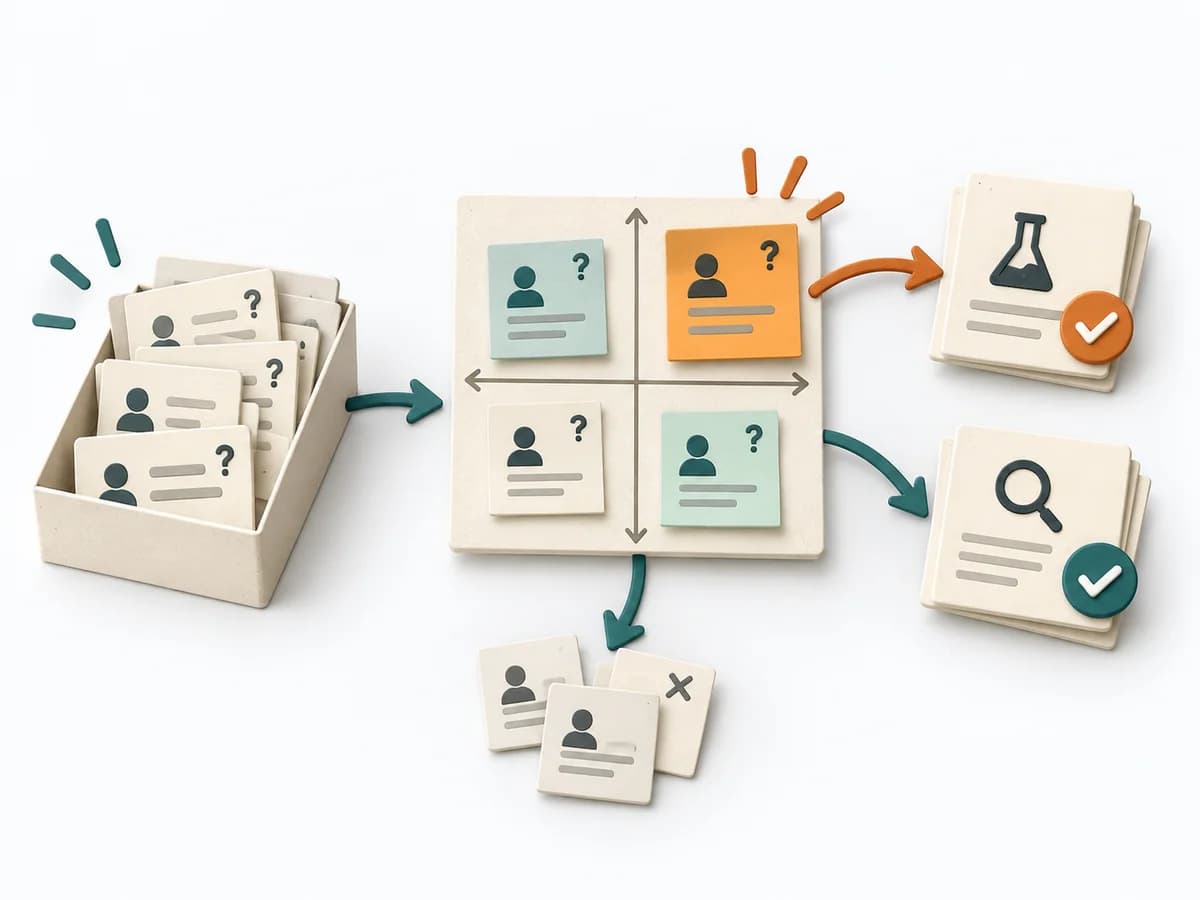 Decision Making Assumption Surfacing |
|---|---|---|---|---|
Purposedifferent | A Causal Loop Diagram makes feedback, reinforcement, and balance in a system legible. It uncovers side effects and self-reinforcement that stay hidden in linear explanations. | Knowledge Mapping makes knowledge, gaps, and transfer paths visible across a field. It fits when expertise should not just exist but also be findable and transferable. | For strategic decisions with high reach, agreement and gut feeling are often not enough. Red teaming brings deliberate opposition into the situation and tests where a plan breaks under real counterarguments. | Plans often contain assumptions that were never openly stated and remain dangerous precisely because of that. Assumption Surfacing makes these silent premises visible and prioritizes which of them carry the initiative or could sink it. |
Complexitydifferent | Medium | Medium | High | Low |
Timedifferent | 1-3 h | 1-3 h | 1-4 h | 45-90 min |
Participantsdifferent | 2-8 | 3-12 | 3-8 | 2-8 |
Formatdifferent | Workshop | Workshop | Workshop | Workshop + async |
Outputdifferent | Causal Loop Diagram, Feedback Notes, Leverage Points | Knowledge Map, Critical Knowledge Areas, Transfer Plan | Challenge Findings, Risk Register, Mitigation Plan | Assumption List, Critical Assumptions, Learning Plan |
Tagsno overlap | FeedbackSystems thinkingCausalityDynamics | KnowledgeMappingRisk | RiskDecisionSensemaking | AssumptionsRiskDecisionDiscovery |