View methods side by side.
Choose up to four methods. Add them using the search and share the comparison by copying its link.
| Criterion |  Systems Thinking Causal Loop Diagram | 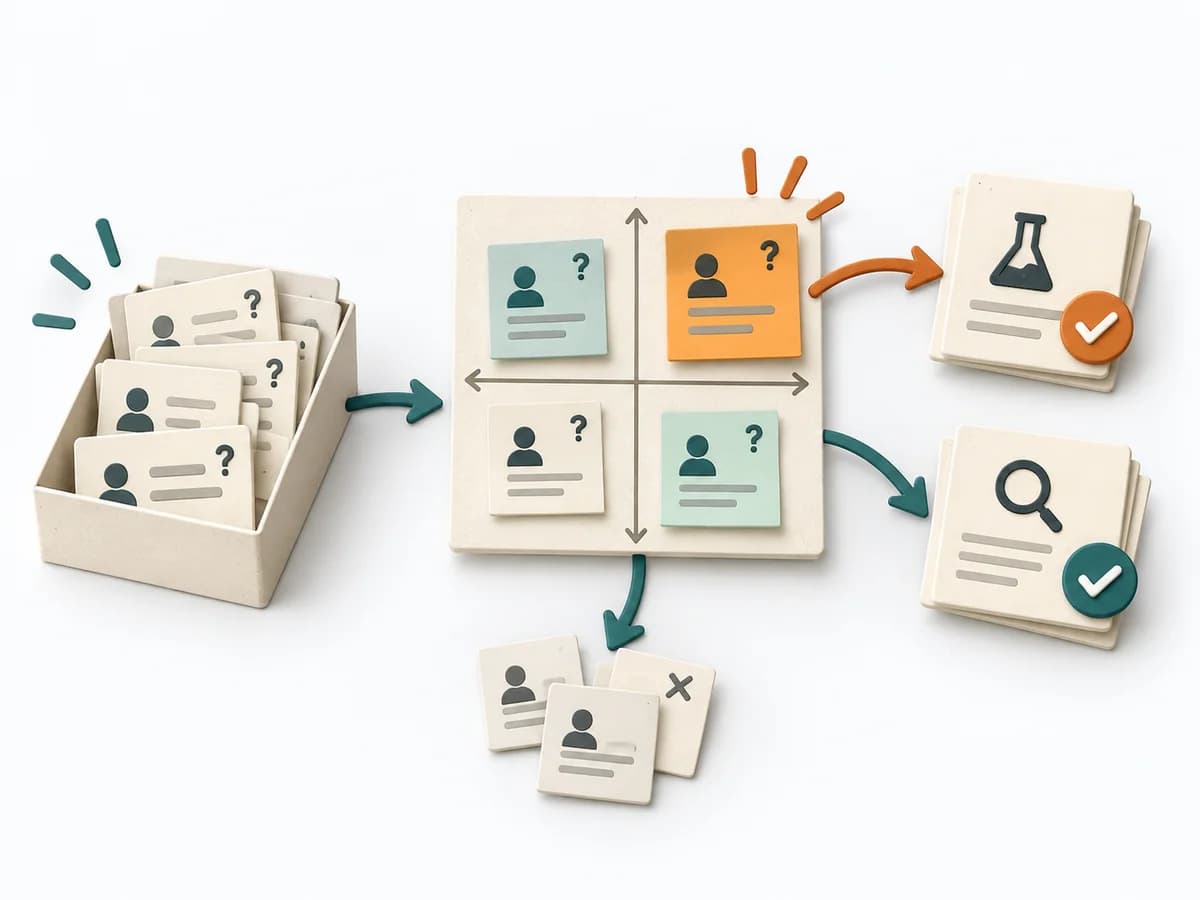 Decision Making Assumption Surfacing |  Systems Thinking Wardley Mapping |  Product Strategy DIBB |
|---|---|---|---|---|
Purposedifferent | A Causal Loop Diagram makes feedback, reinforcement, and balance in a system legible. It uncovers side effects and self-reinforcement that stay hidden in linear explanations. | Plans often contain assumptions that were never openly stated and remain dangerous precisely because of that. Assumption Surfacing makes these silent premises visible and prioritizes which of them carry the initiative or could sink it. | Wardley Mapping makes visible where an offering stands today and where it can evolve. The method connects user need, value chain, and evolution stages into a strategic basis for platform, build, or buy decisions. | DIBB helps clarify target groups, value, goals, and priorities by making the logic behind a decision explicit. It captures results as a DIBB document, belief list, bet list, and learning report. |
Complexitydifferent | Medium | Low | Medium | Low |
Timedifferent | 1-3 h | 45-90 min | 1-3 h | 1-2 h |
Participantsdifferent | 2-8 | 2-8 | 2-10 | 2-8 |
Formatdifferent | Workshop | Workshop + async | Workshop + async | Workshop + async |
Outputdifferent | Causal Loop Diagram, Feedback Notes, Leverage Points | Assumption List, Critical Assumptions, Learning Plan | Wardley Map, Strategic Options, Evolution Notes | DIBB document, Belief list, Bet list, Learning report |
Tagsno overlap | FeedbackSystems thinkingCausalityDynamics | AssumptionsRiskDecisionDiscovery | StrategySystems thinkingDynamics | StrategyDecisionAssumptionsHypothesis |