View methods side by side.
Choose up to four methods. Add them using the search and share the comparison by copying its link.
| Criterion |  Systems Thinking Causal Loop Diagram | 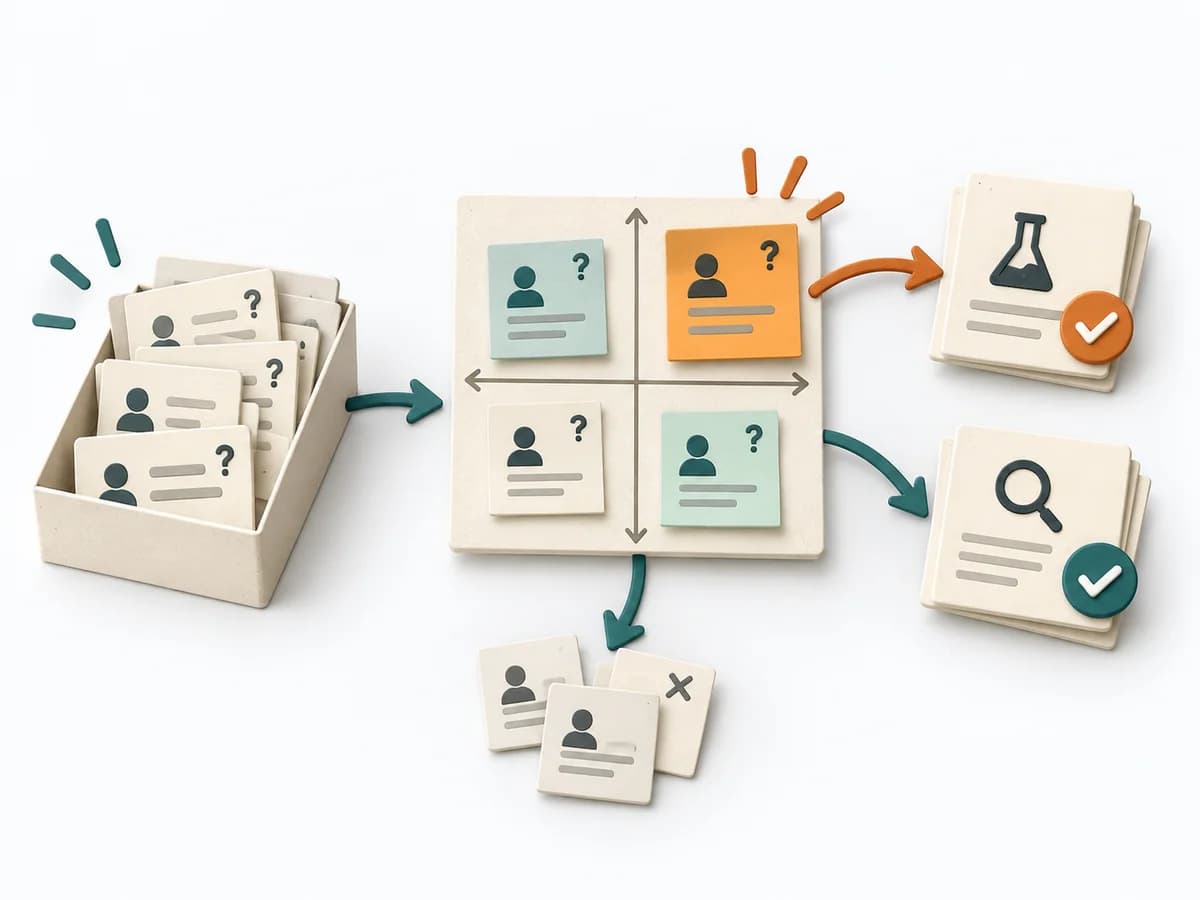 Decision Making Assumption Surfacing |  Product Discovery Fake Door Test |  Product Discovery Assumption Mapping |
|---|---|---|---|---|
Purposedifferent | A Causal Loop Diagram makes feedback, reinforcement, and balance in a system legible. It uncovers side effects and self-reinforcement that stay hidden in linear explanations. | Plans often contain assumptions that were never openly stated and remain dangerous precisely because of that. Assumption Surfacing makes these silent premises visible and prioritizes which of them carry the initiative or could sink it. | When demand is still unclear, it measures interest in a feature before it is built. It separates real behavior from polite agreement and deliberately keeps build effort small. | When assumptions still sit unordered in the room, it weighs uncertainty against leverage. It makes visible which hypotheses should be checked first. |
Complexitydifferent | Medium | Low | Medium | Medium |
Timedifferent | 1-3 h | 45-90 min | 1-5 Tage | 45-60 min |
Participantsdifferent | 2-8 | 2-8 | Nutzertraffic | 2-8 |
Formatdifferent | Workshop | Workshop + async | Async | Workshop + async |
Outputdifferent | Causal Loop Diagram, Feedback Notes, Leverage Points | Assumption List, Critical Assumptions, Learning Plan | Click Data, Interest Signal, Learning Decision | Assumption map, Test backlog, Risk ranking |
Tagsno overlap | FeedbackSystems thinkingCausalityDynamics | AssumptionsRiskDecisionDiscovery | ValidationExperimentsDemandDiscovery | AssumptionsRiskExperimentsValidation |