View methods side by side.
Choose up to four methods. Add them using the search and share the comparison by copying its link.
| Criterion | 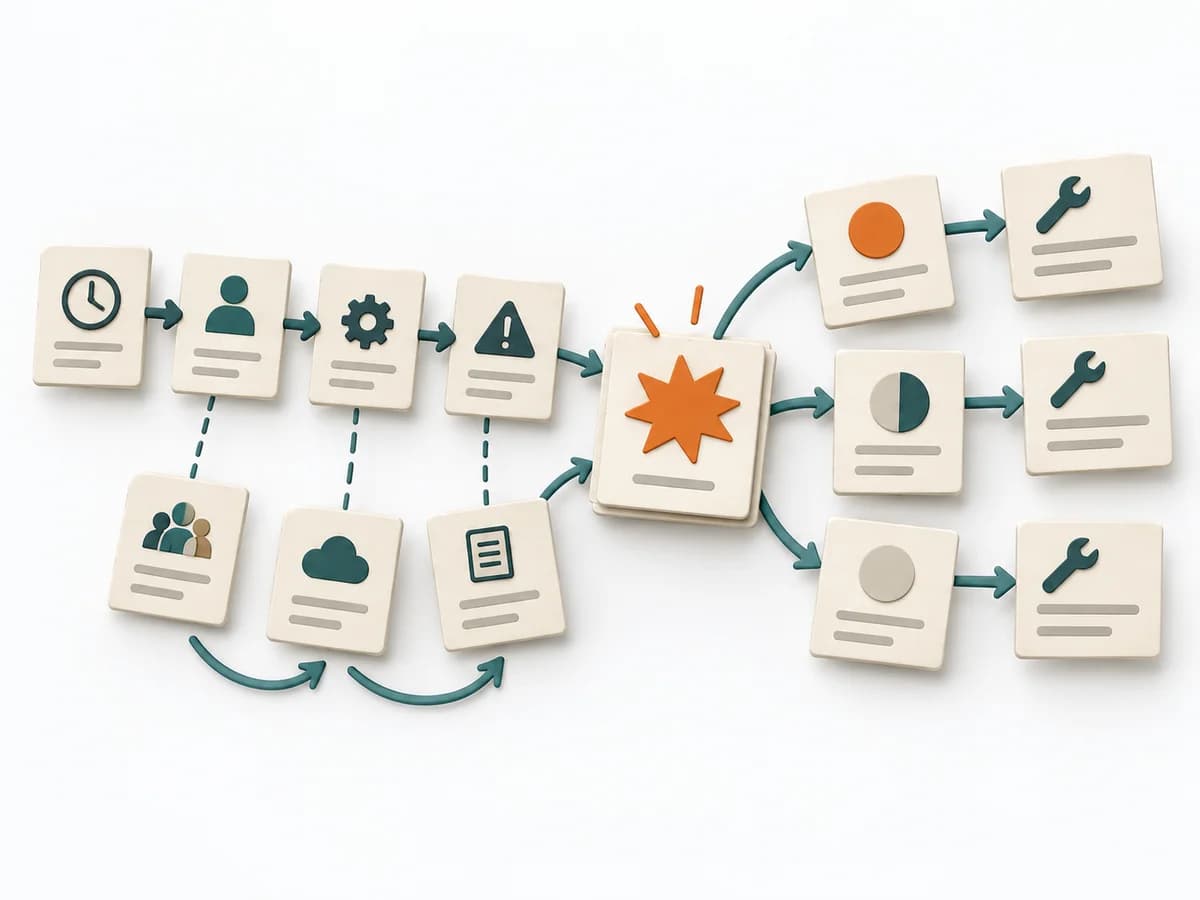 Operations Causal Factor Analysis |  Operations Fishbone Diagram |  Operations Kepner-Tregoe |  Operations 5 Whys |
|---|---|---|---|---|
Purposedifferent | For an event with a complicated course, the method breaks down the contributing factors along the timeline. It shows how conditions, decisions, and reactions together produce a course of events. | When a problem has several possible contributing factors, the method sorts causes by cause areas. It prevents an initial hunch from blocking the view of other plausible drivers. | For a disturbance that's hard to pin down, the method cleanly separates problem, cause, and decision. It reduces mixing when symptoms allow several interpretations. | For a single, hard-to-explain deviation, the method exposes the causal chain behind the visible symptom. It keeps the cause open until a controllable condition emerges instead of a mere description. |
Complexitydifferent | High | Low | High | Low |
Timedifferent | 2-6 h | 30-60 min | 2-8 h | 15-30 min |
Participantsdifferent | 3-10 | 2-8 | 2-8 | 2-6 |
Formatdifferent | Workshop + async | Workshop | Workshop + async | Workshop |
Outputdifferent | Event Timeline, Causal Factor Chart, Cause List, Corrective Actions | Fishbone Diagram, Cause Categories, Investigation Backlog | Problem Analysis, Decision Analysis, Risk Plan | Root cause notes, Countermeasures |
Tags1 shared | CausalityIncidentRoot causeTimeline | Root causeQualityOperations | Problem solvingRoot causeDecisionOperations | Root causeIncidentLeanProblem solving |