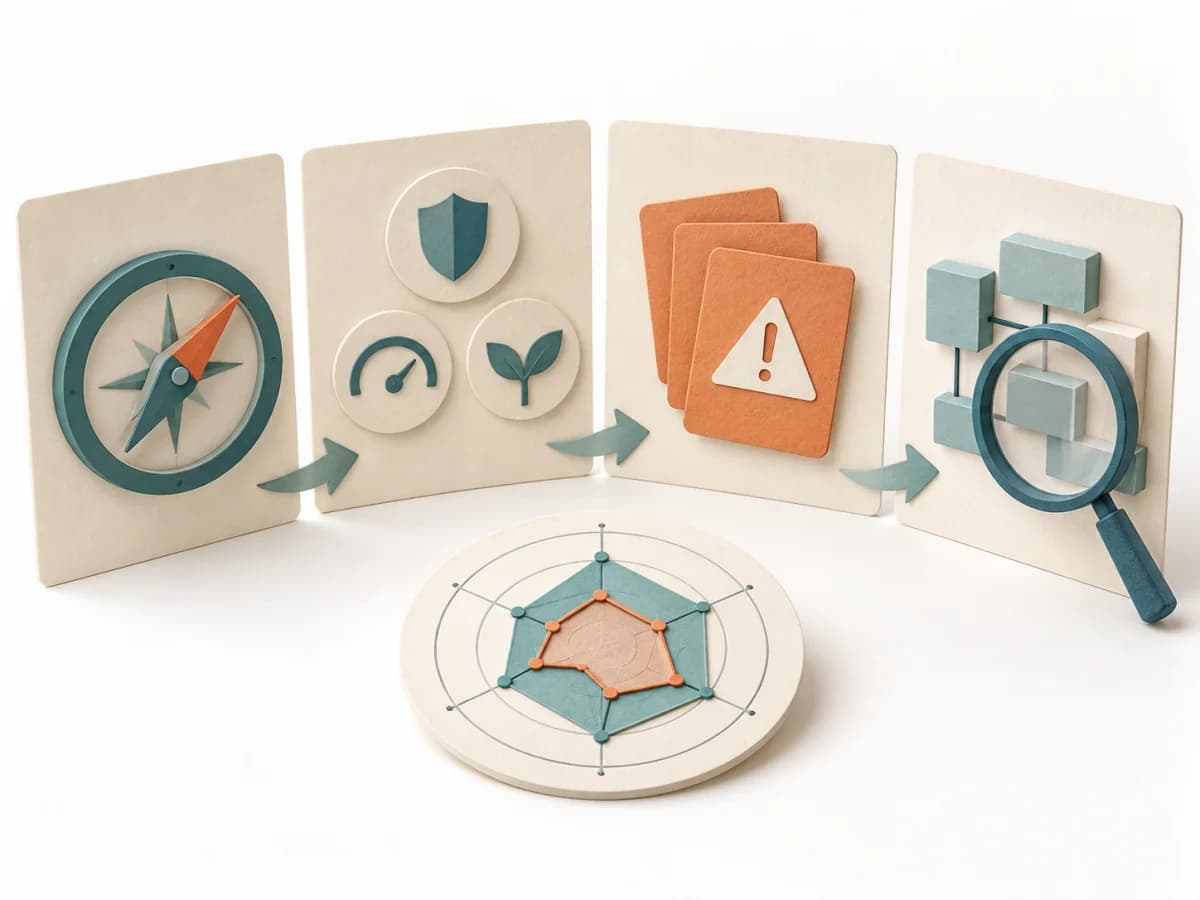
View methods side by side.
Choose up to four methods. Add them using the search and share the comparison by copying its link.
| Criterion |  UX Research Card Sorting |  Operations Fishbone Diagram |  Architecture ATAM (Architecture Tradeoff Analysis Method) |
|---|---|---|---|
Purposedifferent | When content only makes sense internally and users can't find the structure again, card sorting exposes their mental order. Terms, groups, and naming are then aligned with the target group's expectations. | When a problem has several possible contributing factors, the method sorts causes by cause areas. It prevents an initial hunch from blocking the view of other plausible drivers. | ATAM helps teams weigh architecture decisions when quality goals compete. The team considers business goals, stakeholder expectations, and technical decisions together. The evaluation shows which risks need further investigation. |
Complexitydifferent | Low | Low | High |
Timedifferent | 20-45 min | 30-60 min | Several meetings plus preparation and analysis; total effort depends on scope |
Participantsdifferent | Based on research question | 2-8 | Evaluation team, architects, and relevant stakeholders |
Formatdifferent | Workshop + async | Workshop | Workshop + async |
Outputdifferent | Content groups, Label set, IA hypotheses | Fishbone Diagram, Cause Categories, Investigation Backlog | Prioritized quality scenarios in a utility tree, Architecture risks with reasoning and assumptions, Sensitivity and trade-off points, Findings report with open investigations |
Tagsno overlap | Information architectureNavigationStructure | Root causeQualityOperations | ArchitectureQualityRiskTradeoffsStakeholders |
Often compared together
Methods with strong topical overlap with the current selection, not yet in the comparison.