View methods side by side.
Choose up to four methods. Add them using the search and share the comparison by copying its link.
| Criterion | 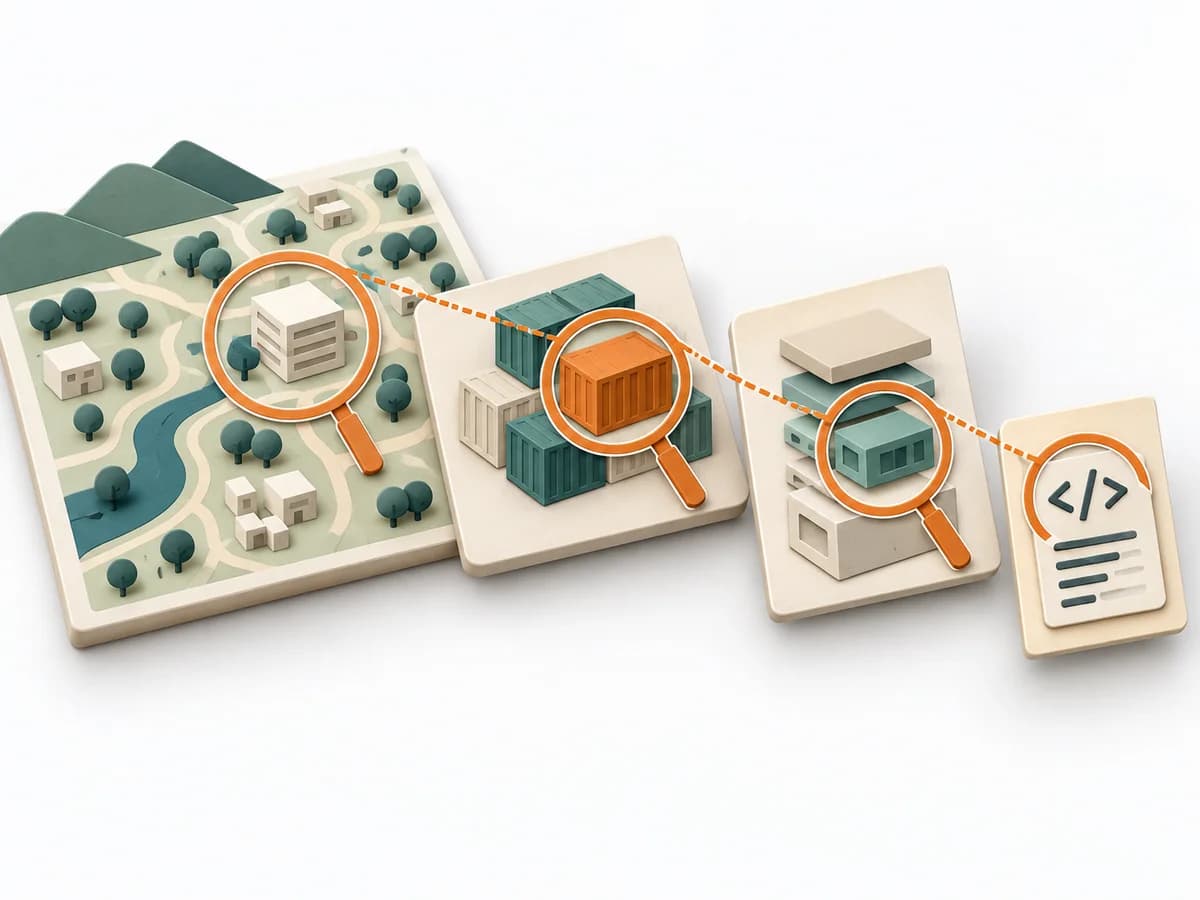 Architecture C4 Model |  Delivery Monte Carlo Forecasting | 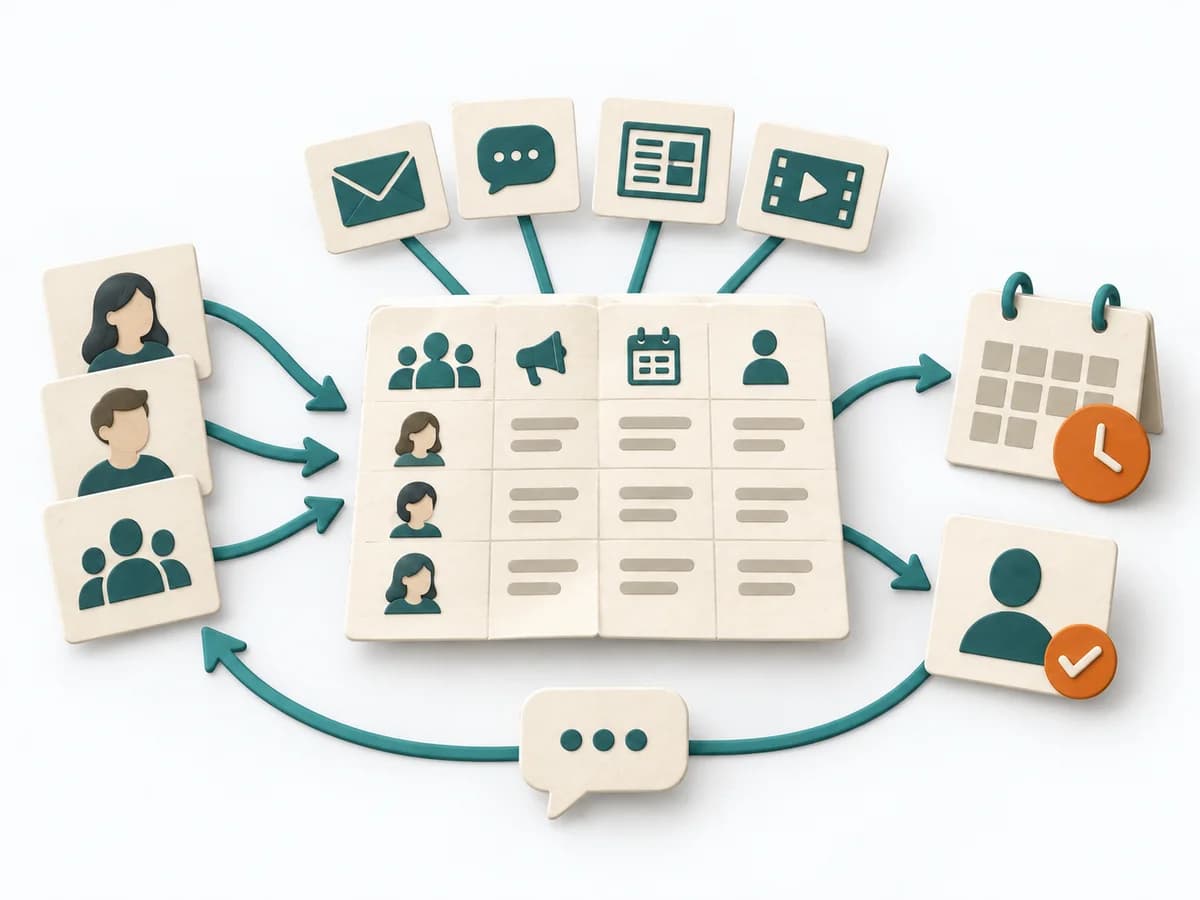 Delivery Communication Plan |  Agile NoEstimates |
|---|---|---|---|---|
Purposedifferent | The C4 Model makes a system legible across several resolution levels, from context down to code. It suits situations where different audiences need to understand the same architecture from different altitudes. | Helps clarify scope, sequence, and delivery flow in concrete terms. It makes work, boundaries, and order steerable. The result is captured as Forecast Percentiles, Throughput Dataset, and Risk Communication. | When many people need to be informed in parallel and messages would otherwise arrive unevenly or too late, a Communication Plan orders communication reliably. Channels, audiences, and cadences interlock so important information doesn't get lost. | When estimating slows a team down more than it helps, it shifts the focus to flow, small slices, and real lead time. It sorts work by value, risk, and delivery ability. The result is captured as Throughput Data, Flow Forecast, and Slicing Rules. |
Complexitydifferent | Low | High | Low | Medium |
Timedifferent | 1-4 h | 30-90 min Setup, danach laufend | 45-90 min | laufend |
Participantsdifferent | 1-5 | 1-8 | 2-6 | 2-12 |
Formatsame | Workshop + async | Workshop + async | Workshop + async | Workshop + async |
Outputdifferent | Context Diagram, Container Diagram, Component Diagram | Forecast Percentiles, Throughput Dataset, Risk Communication | Communication Plan, Channel Matrix, Message Cadence | Throughput Data, Flow Forecast, Slicing Rules |
Tagsno overlap | ArchitectureCommunicationVisualization | ForecastingFlowDelivery | CommunicationStakeholdersDeliveryPlanning | EstimationForecastingFlow |