View methods side by side.
Choose up to four methods. Add them using the search and share the comparison by copying its link.
| Criterion | 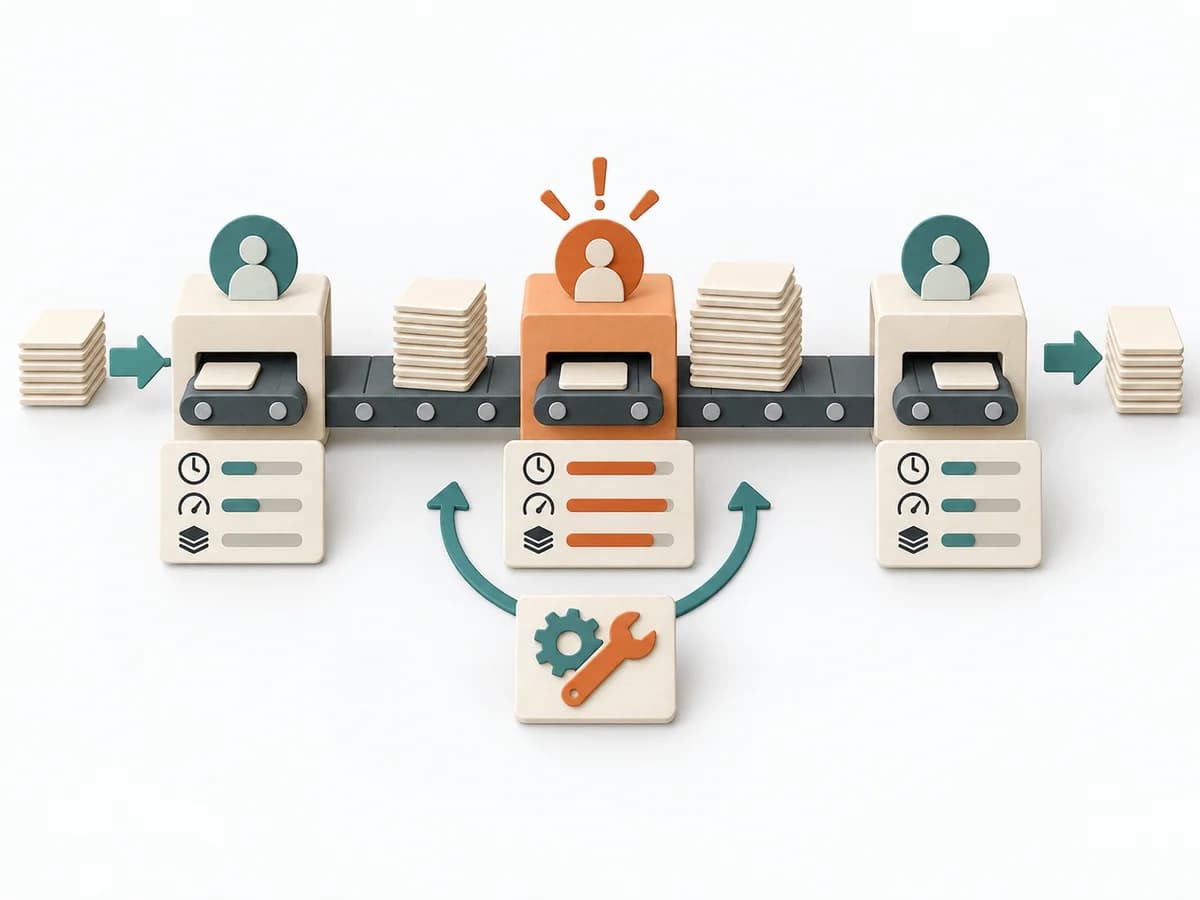 Operations Bottleneck Analysis | 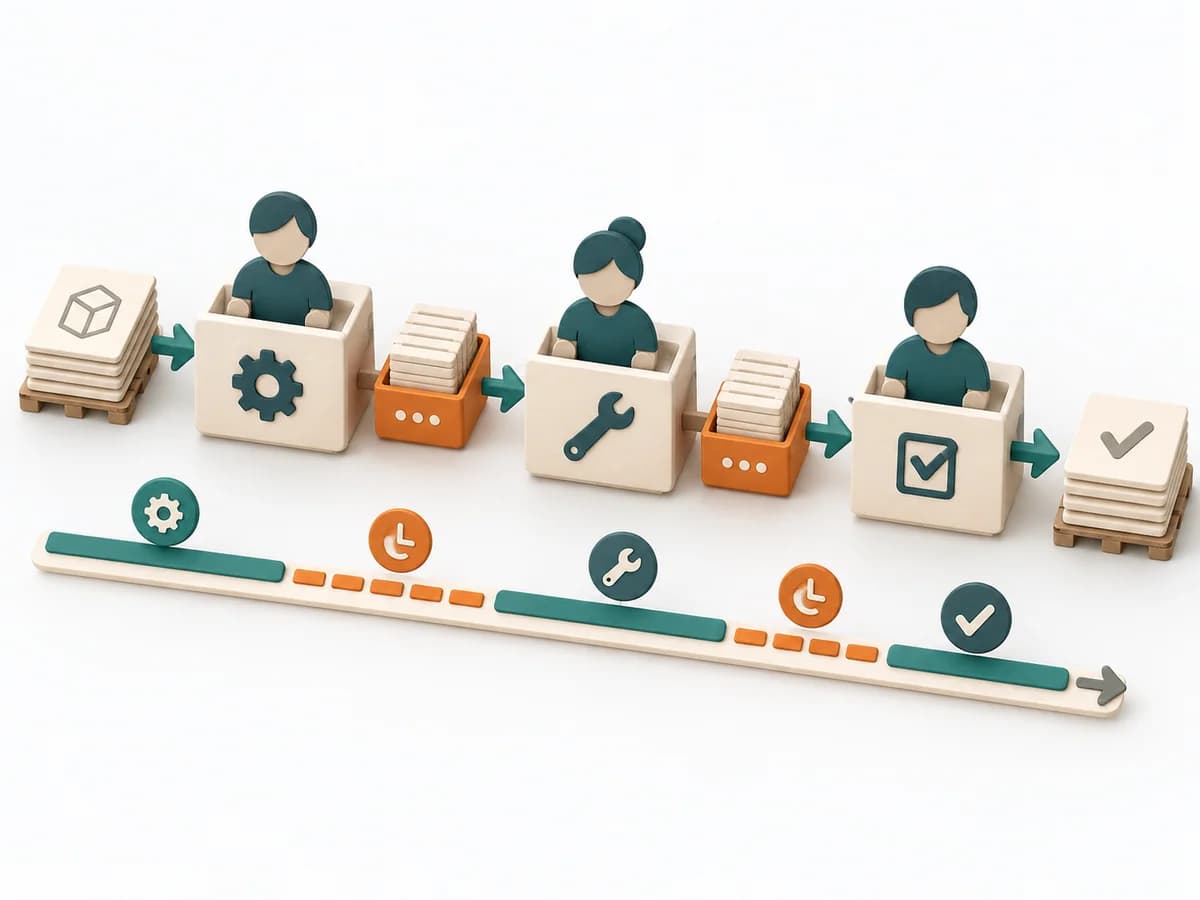 Delivery Value Stream Mapping | 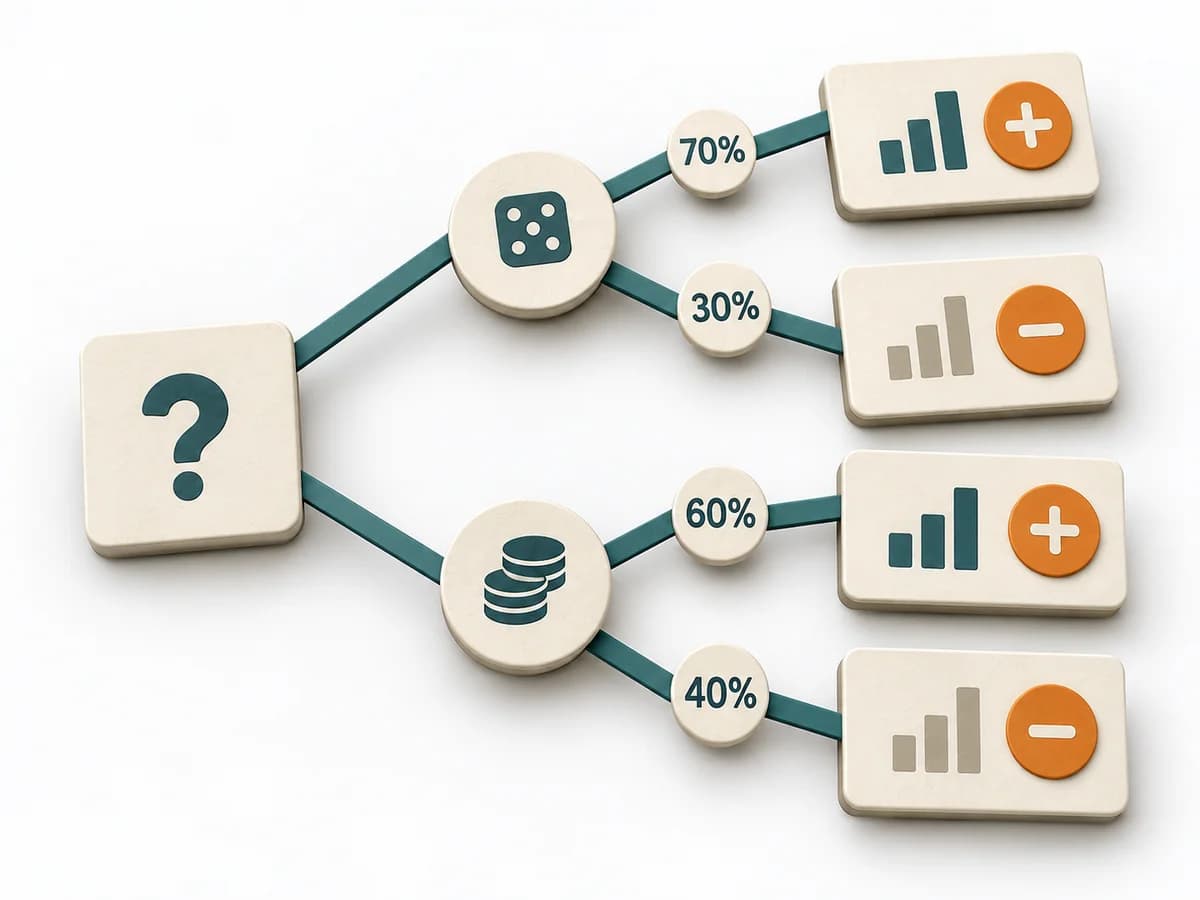 Decision Making Decision Tree |  Delivery Cost of Delay |
|---|---|---|---|---|
Purposedifferent | For a flow that backs up at one point, the method looks for the capacity limit with the greatest leverage. It explains why extra effort elsewhere barely improves throughput. | When delivery work dissolves into wait times, handoffs, and hidden effort, Value Stream Mapping makes the actual flow visible. The method exposes bottlenecks, idle time, and feedback loops so lead time and improvement levers become tangible. | For decisions with follow-on paths and dependencies, a linear comparison is often not enough. A Decision Tree shows how options branch under conditions and which consequences hang on each branch. | Helps clarify scope, order, and delivery flow in concrete terms. It makes work, constraints, and sequence manageable. The result is captured as a Cost of Delay table and prioritization sequence. |
Complexitydifferent | Medium | Medium | Medium | High |
Timedifferent | 1-3 h | 1-3 h | 30-90 min | 90-180 min |
Participantsdifferent | 3-8 | 4-10 | 1-6 | 3-8 |
Formatdifferent | Workshop + async | Workshop | Workshop + async | Workshop |
Outputdifferent | Bottleneck Map, Flow Metrics, Improvement Options, Follow-up Measures | Current-state map, Future-state map, Bottleneck list | Decision Tree, Option Map, Assumption List | CoD Table, Prioritization Sequence |
Tagsno overlap | FlowMeasurementConstraints | LeanFlowWasteDelivery | DecisionTreeOptions | PrioritizationDeliveryEconomicsDecision |