View methods side by side.
Choose up to four methods. Add them using the search and share the comparison by copying its link.
| Criterion | 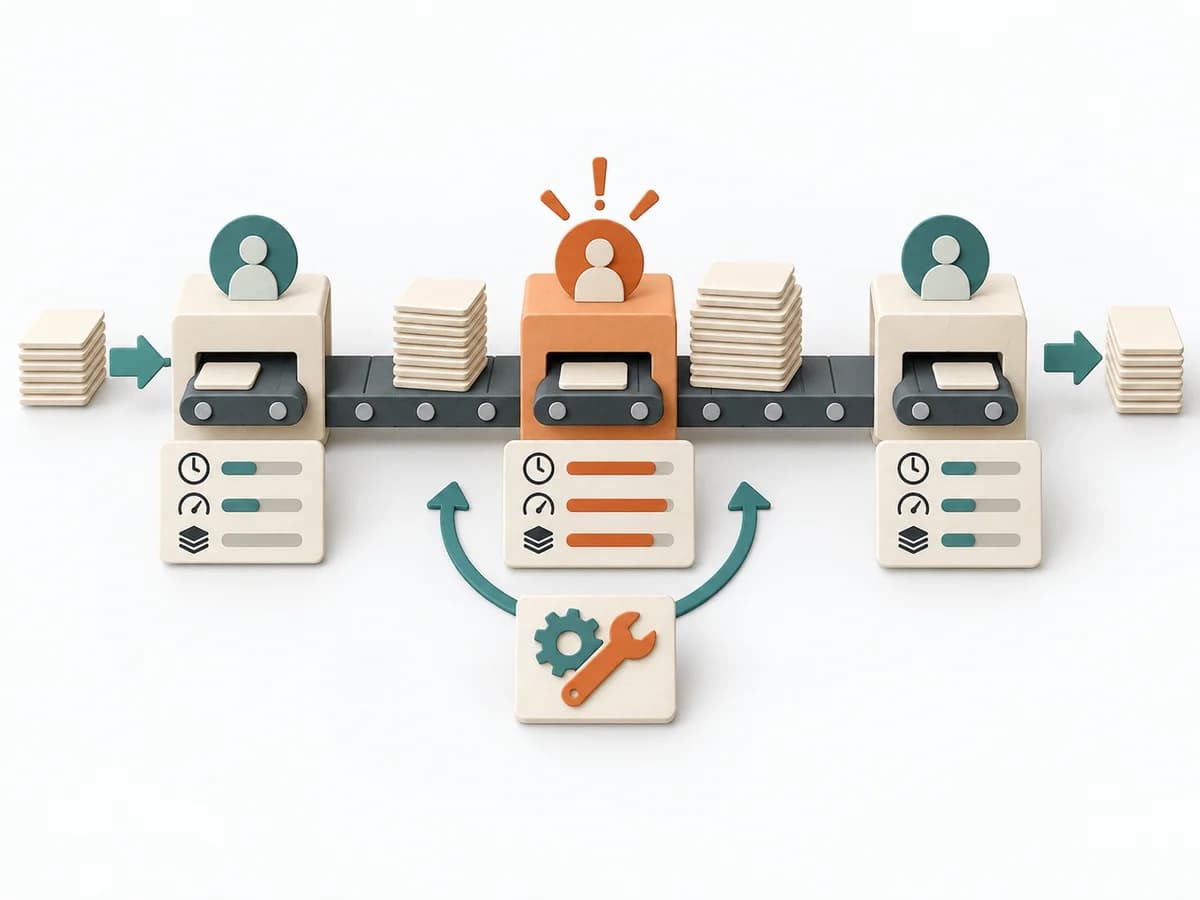 Operations Bottleneck Analysis | 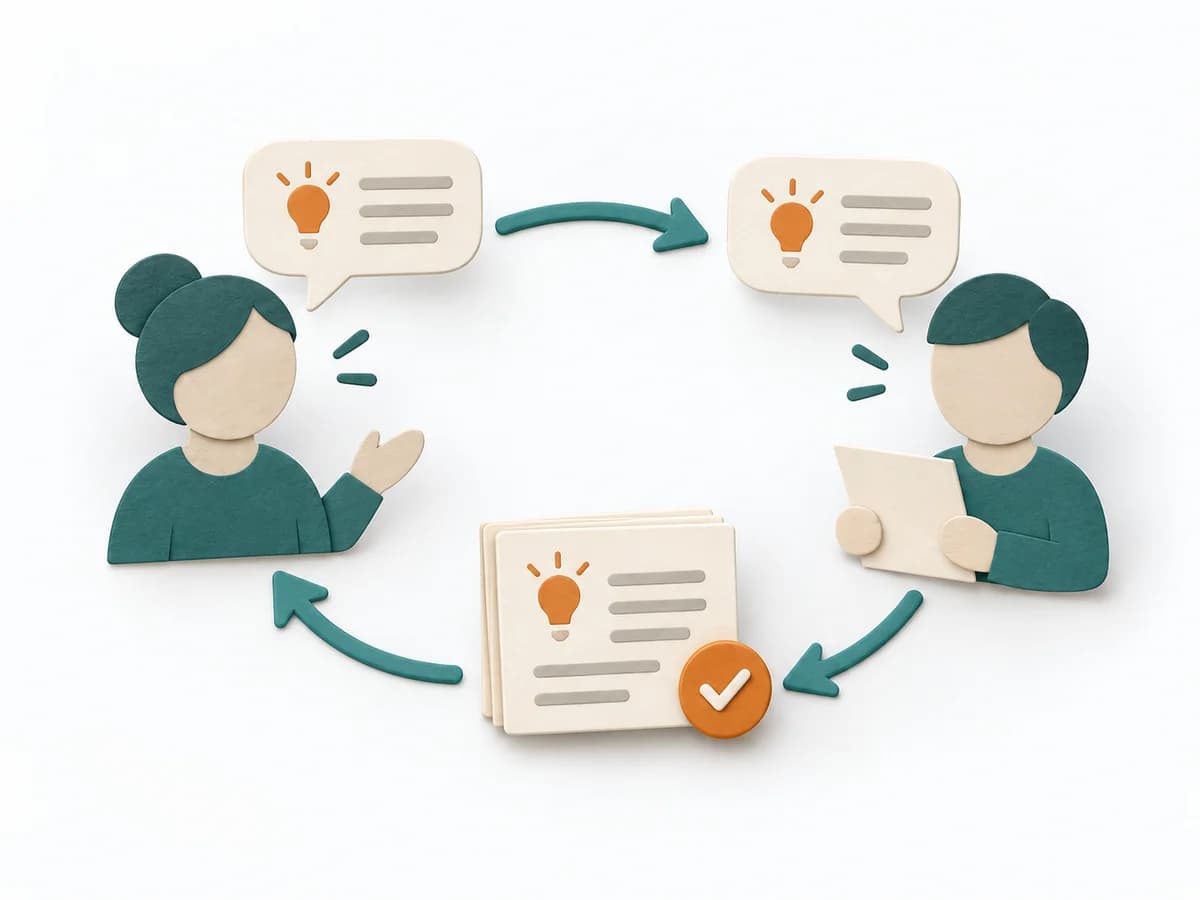 Knowledge Modeling Teach-back |  Operations Process Mapping | 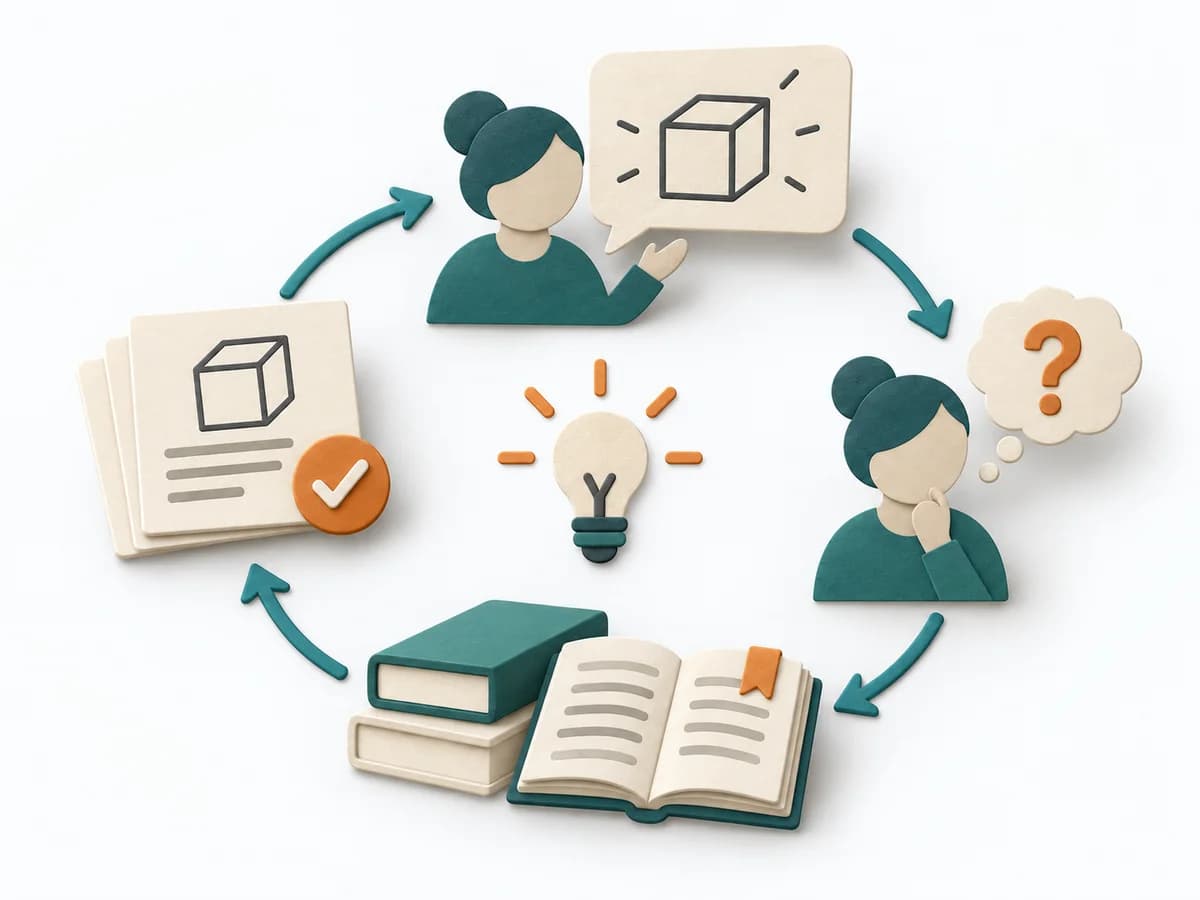 Knowledge Modeling Feynman Technique |
|---|---|---|---|---|
Purposedifferent | For a flow that backs up at one point, the method looks for the capacity limit with the greatest leverage. It explains why extra effort elsewhere barely improves throughput. | Teach-back checks whether an explanation actually got through to the other person. The method makes misunderstandings visible early and strengthens shared understanding in advisory and learning situations. | With a confusing workflow that has many handoffs, the method makes the actual process visible. It shows where work is passed on, delayed, or duplicated, so improvement targets the right spots. | The Feynman Technique checks understanding by explaining a topic so that it stays easy for others to understand. It makes knowledge gaps visible before they become costly in everyday work. |
Complexitydifferent | Medium | Low | Medium | Low |
Timedifferent | 1-3 h | 5-20 min | 1-3 h | 20-60 min |
Participantsdifferent | 3-8 | 2-8 | 3-10 | 1 |
Formatdifferent | Workshop + async | Workshop + async | Workshop | Async |
Outputdifferent | Bottleneck Map, Flow Metrics, Improvement Options, Follow-up Measures | Understanding Check, Clarification Notes, Learning Gaps | Process Map, Handoff List, Improvement Backlog | Plain-language Explanation, Knowledge Gaps, Study Notes |
Tagsno overlap | FlowMeasurementConstraints | LearningUnderstandingCommunication | ProcessOperationsImprovement | LearningKnowledgeUnderstanding |