View methods side by side.
Choose up to four methods. Add them using the search and share the comparison by copying its link.
| Criterion | 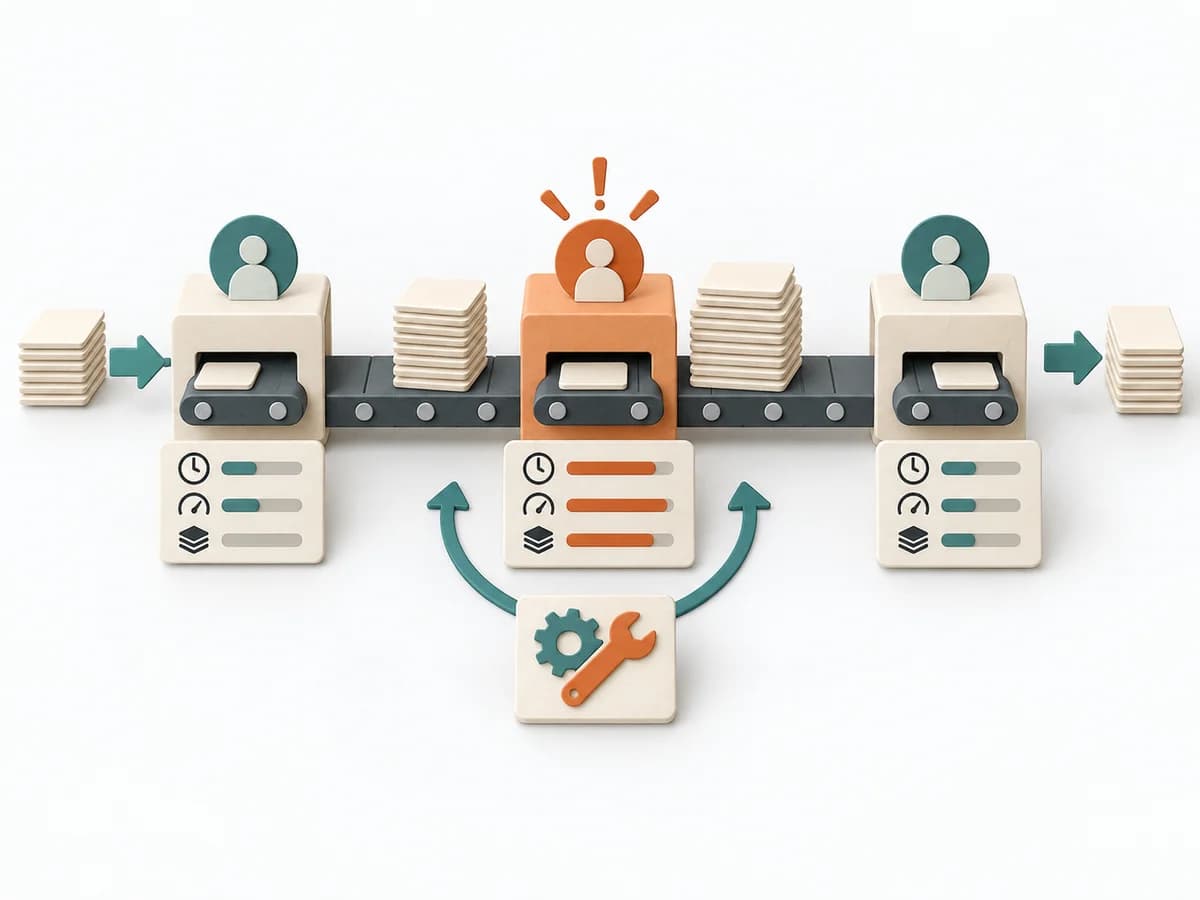 Operations Bottleneck Analysis | 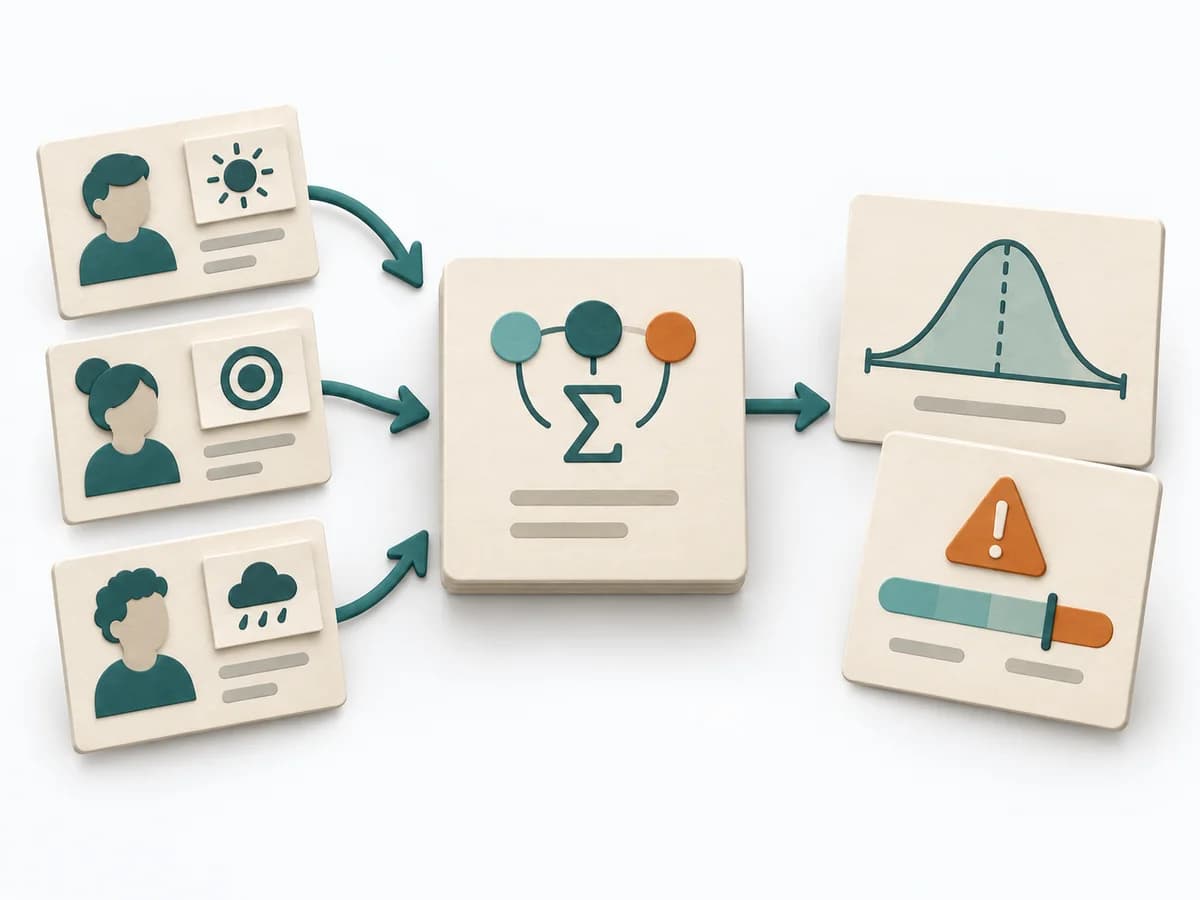 Decision Making PERT Estimation | 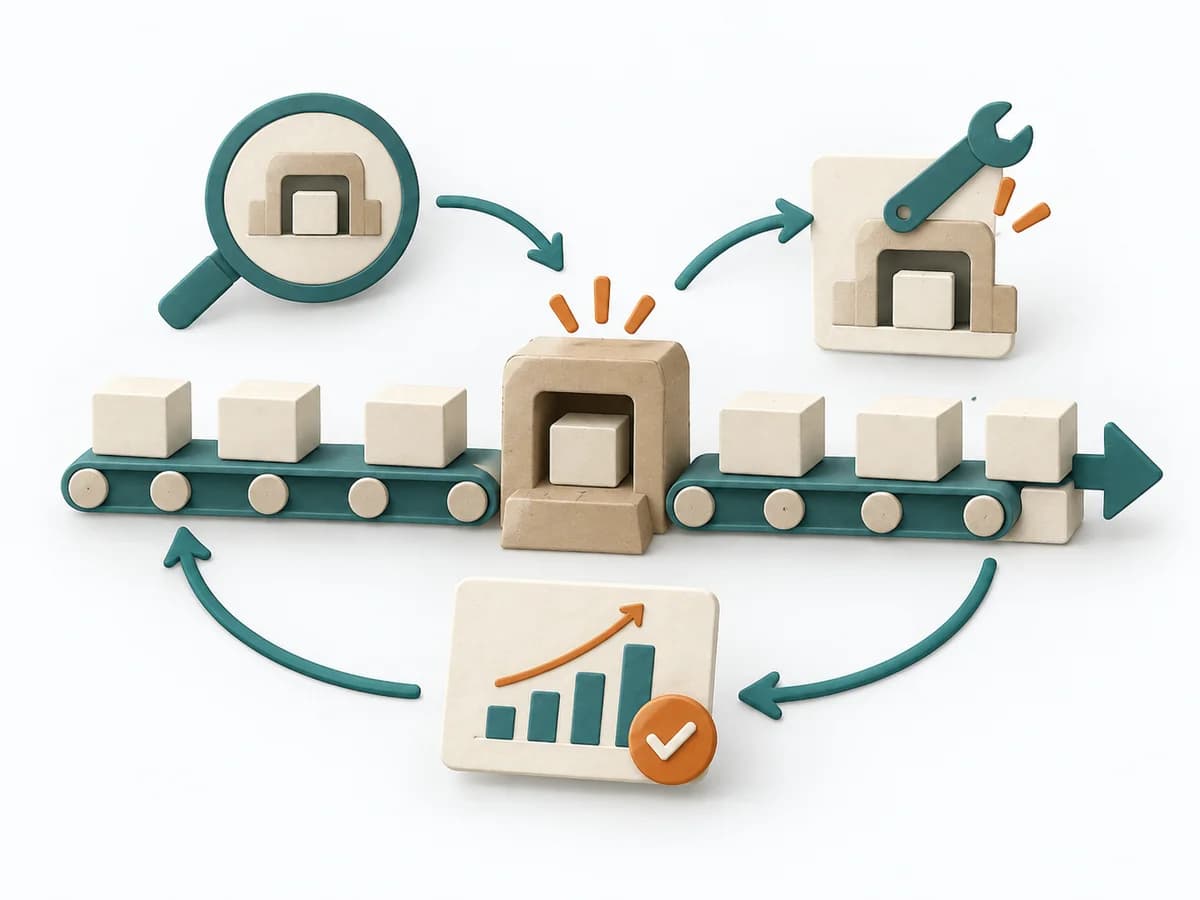 Operations Theory of Constraints |  Agile NoEstimates |
|---|---|---|---|---|
Purposedifferent | For a flow that backs up at one point, the method looks for the capacity limit with the greatest leverage. It explains why extra effort elsewhere barely improves throughput. | On complex initiatives, a plain average tends to understate just how uncertain the outcome really is. It separates options, evaluation criteria, and open risks. The result is captured as a PERT Estimate, Expected Value, and Risk Notes. | For a system that does not get faster despite effort, the method directs attention to the bottleneck. It concentrates improvement on the point that actually limits throughput. | When estimating slows a team down more than it helps, it shifts the focus to flow, small slices, and real lead time. It sorts work by value, risk, and delivery ability. The result is captured as Throughput Data, Flow Forecast, and Slicing Rules. |
Complexitydifferent | Medium | Medium | High | Medium |
Timedifferent | 1-3 h | 15-45 min | 2-4 h Analyse, laufend | laufend |
Participantsdifferent | 3-8 | 1-8 | 3-12 | 2-12 |
Formatsame | Workshop + async | Workshop + async | Workshop + async | Workshop + async |
Outputdifferent | Bottleneck Map, Flow Metrics, Improvement Options, Follow-up Measures | PERT Estimate, Expected Value, Risk Notes | Constraint Map, Improvement Plan, Flow Metrics | Throughput Data, Flow Forecast, Slicing Rules |
Tagsno overlap | FlowMeasurementConstraints | EstimationUncertaintyRisk | OperationsConstraintsFlowImprovement | EstimationForecastingFlow |