View methods side by side.
Choose up to four methods. Add them using the search and share the comparison by copying its link.
| Criterion | 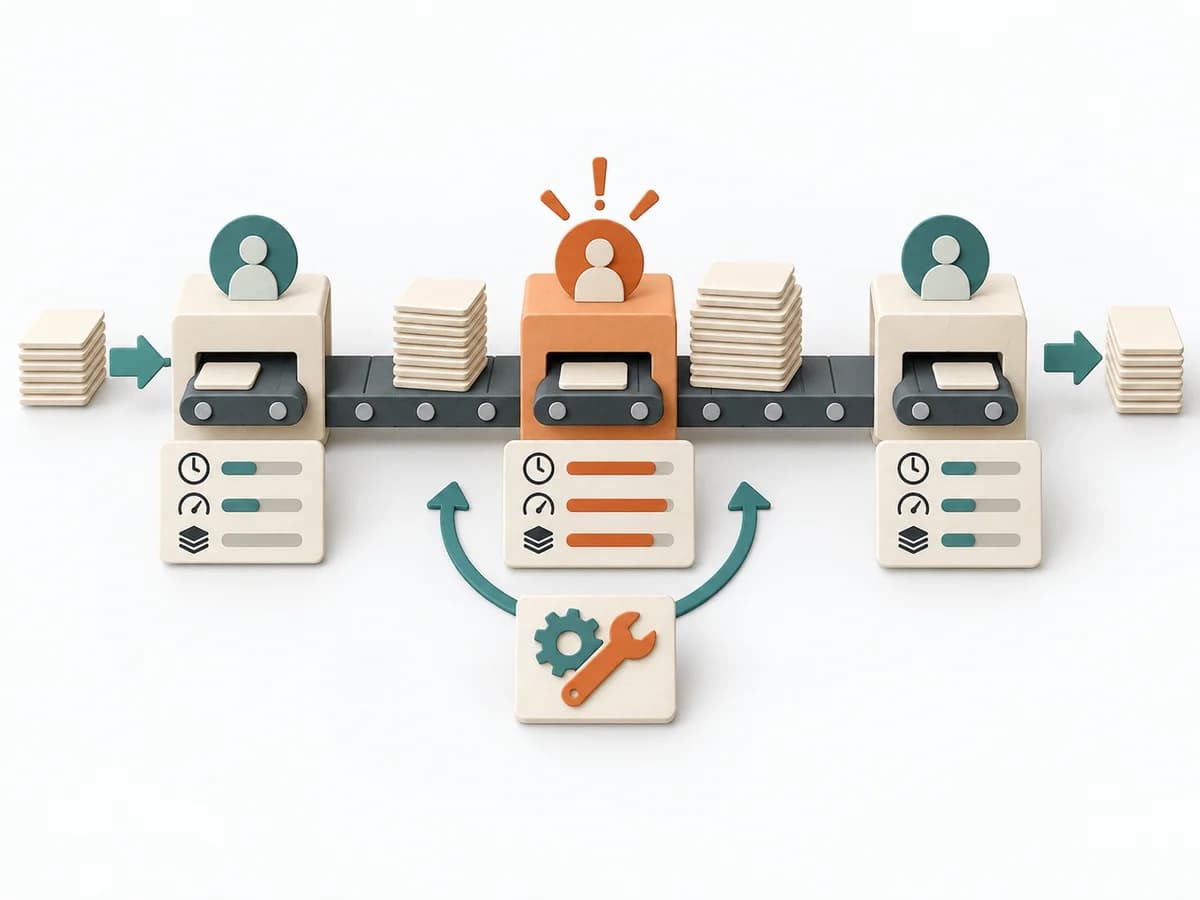 Operations Bottleneck Analysis | 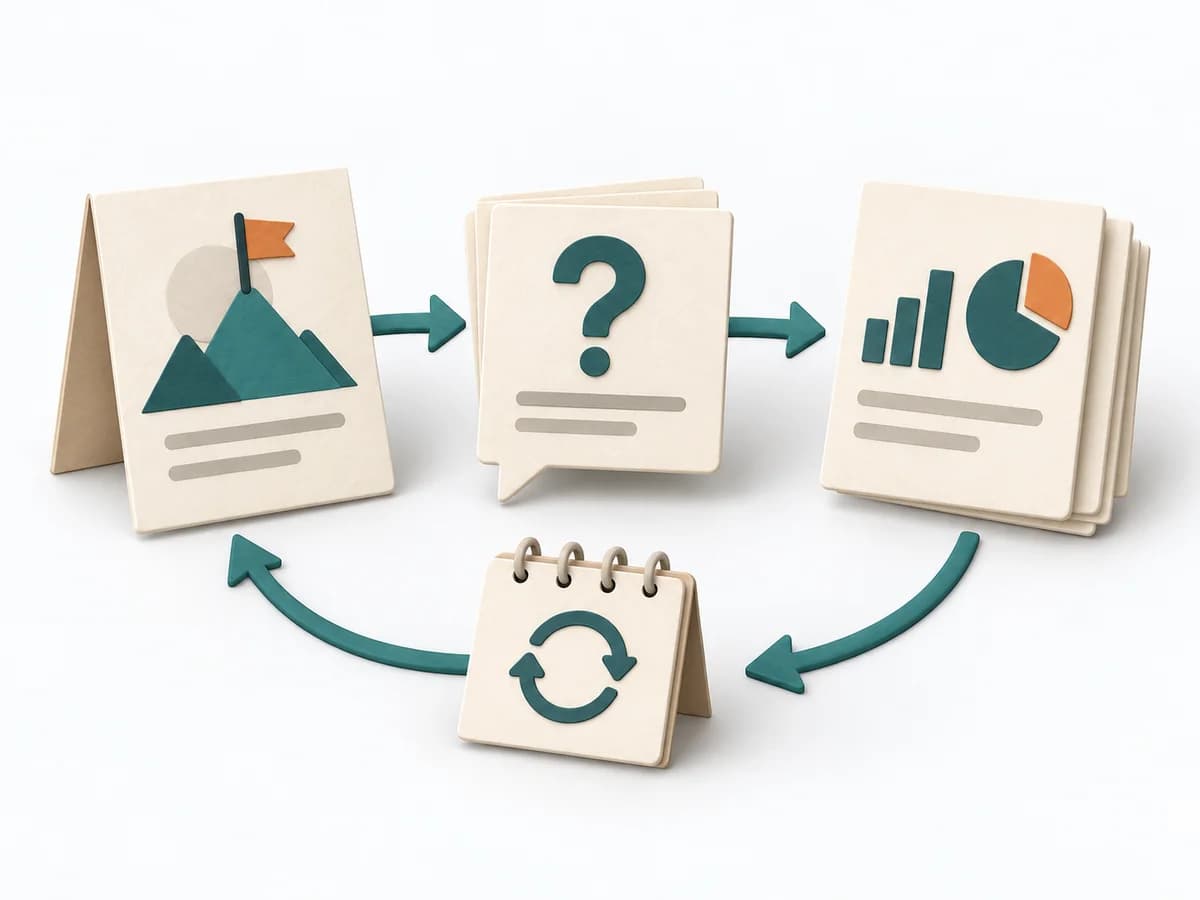 Engineering Goal Question Metric |  Facilitation Expectation Mapping | 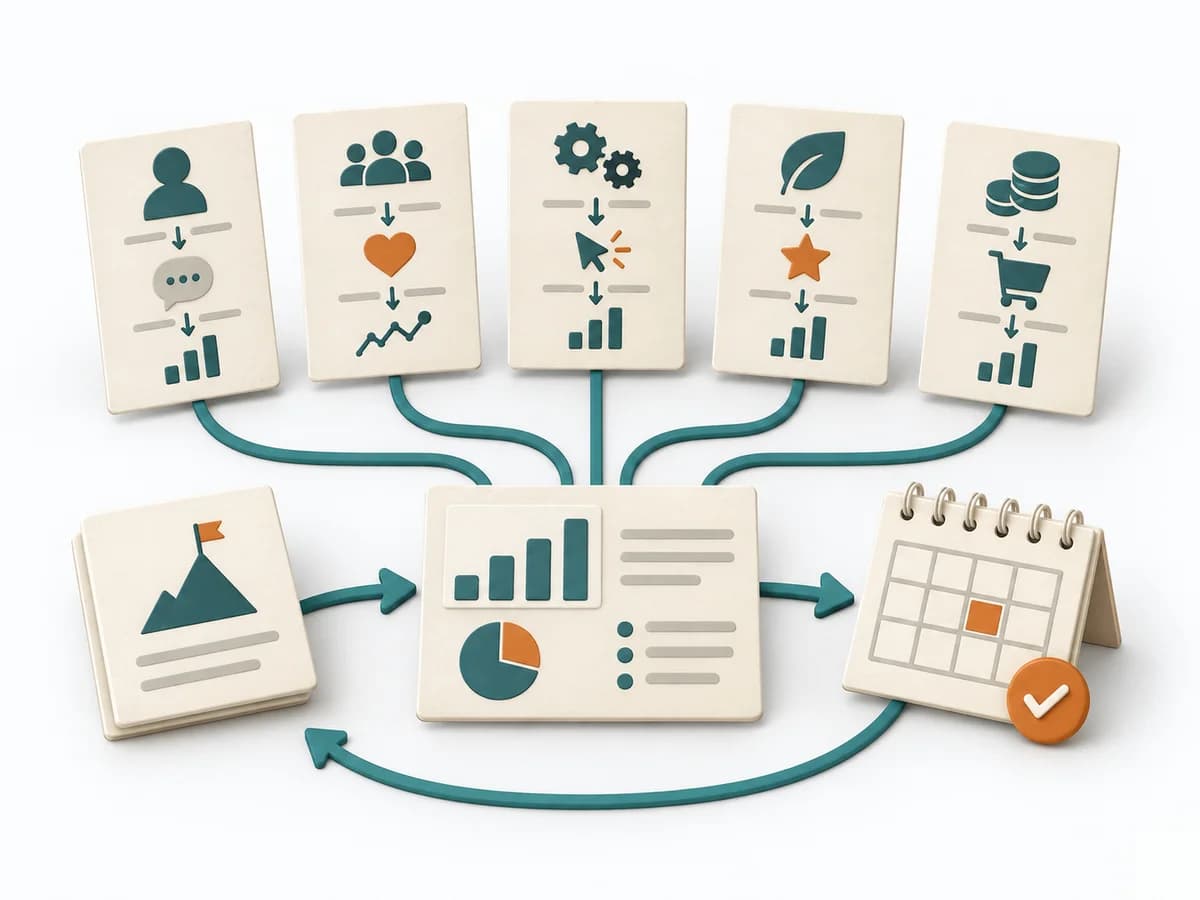 UX Research HEART Framework |
|---|---|---|---|---|
Purposedifferent | For a flow that backs up at one point, the method looks for the capacity limit with the greatest leverage. It explains why extra effort elsewhere barely improves throughput. | Helps clarify technical problems, hypotheses, and next steps in concrete terms. It breaks a technical problem into testable parts. The result is captured as a GQM table and metric briefs. | When roles, interfaces, or projects fail because of differing expectations, Expectation Mapping surfaces these differences. It shows what each side takes for granted and where the pictures diverge. | Helps clarify observations, needs, and patterns in concrete terms. It groups observations into patterns, questions, and decisions. The result is captured as a HEART-GSM table and dashboard. |
Complexitydifferent | Medium | Medium | Low | Medium |
Timedifferent | 1-3 h | 90-180 min | 45-90 min | 120 min initial, dann laufend |
Participantsdifferent | 3-8 | 3-6 | 3-12 | 3-6 |
Formatdifferent | Workshop + async | Workshop | Workshop | Workshop + async |
Outputdifferent | Bottleneck Map, Flow Metrics, Improvement Options, Follow-up Measures | GQM Table, Metric Profiles | Expectation Map, Alignment Notes, Agreements | HEART-GSM Table, Dashboard |
Tagsno overlap | FlowMeasurementConstraints | MetricsMeasurementEngineeringAlignment | AlignmentStakeholdersTeam | MetricsUX researchMeasurementSatisfaction |